Executive Summary
- The market experienced a violent sell-off last week, sending BTC prices below $25k, and ending a period of historically low volatility.
- The market has been slicing through several important price support models, putting the bulls on the back-foot.
- A primary driver appears to be a leverage flush-out in derivatives market, seeing over $2.5B worth of open interest cleared in just a few hours.
- Options markets have sharply repriced volatility premiums from historical lows, although open interest remains remarkably stable.
- Spot markets are still relatively ‘top heavy’, with over 88.3% of Short-Term Holder supply now held at an unrealized loss.
- We introduce a responsive experimental indicator which helps identify inflection points in market profitability and trend.
Technical Damage
The digital asset market experienced a violent sell-off last week, marking a dramatic end to the exhausting lack of volatility that dominated since July. As we covered in the last two editions (WoC 32, WoC 33), price action for BTC had reached some of the lowest volatility levels on record, and options markets in particular had heavily discounted the possibility of significant downside volatility.
After several weeks trading just above $29.3k, BTC prices exploded lower, slicing through several long term moving averages, including the 111-day, 200-day, and the 200-week. With the market closing the week at around $26.1k, this represents a significant loss of market support, and the bulls now have their work cut out for them.

The sell-off also pushed prices below the Short-Term Holder cost basis, an on-chain price model which has historically provided support during robust up-trends. With the Realized Price and Long-Term Holder cost basis trading some distance below ($20.3k), this puts the market in a somewhat precarious position from a psychological standpoint.
As we noted last week (WoC 33), the supply held by the Short-Term Holder cohort is somewhat ‘top heavy’, with a significant majority having a cost basis above $29.0k. This is a topic we will revisit later in this edition.

The weekly price action traded down -11.3%, which is a significant fall, but is not the most significant in recent years. This performance is slightly shy of the long-term one standard deviation move of -12.6%, a level which was breached during major capitulation events such as the collapse events of FTX, 3AC, and LUNA.

On a daily basis however, this is the largest single day sell-off year to date, falling -7.2% on the 17-August. This did exceed a one standard deviation move to the downside, catching the bulls off guard.
📊

Options Reprice Volatility
Implied volatility in options markets had reached all-time lows by the start of the week, trading 50% below the long-term baseline seen throughout 2021-22. Of course, as this week’s sell-off kicked off, volatility was quickly repriced. Implied volatility more than doubled for short dated contracts with an expiry out to the end of September.

Put options naturally experienced the sharpest repricing, with 25-Delta Skew reversing completely, rallying from historical lows of -10% to over +10%. Overall, options traders were shaken violently awake from their sleep, being forced to reevaluate volatility expectations moving forwards.

Interestingly, open interest for both call and put options remained surprisingly stable, with very little net change given the explosive price action. This suggests that whilst volatility was likely mispriced, there wasn’t a great deal of forced deleveraging in options markets.
One development we highlighted in WoC 32 is that the magnitude of open interest in Bitcoin options markets is now comparable to futures markets, meaning analysts should keep a close eye on both.
📊

Options trade volume did spike higher, increasing by 200%+ to $620M/day for calls, and $326M/day for puts. It remains to be seen if this elevated volatility regime sticks around, or whether the prevailing low liquidity environment reverts back to a low enthusiasm market.

Futures Flush-out
Unlike options markets, futures traders did experience a major deleveraging event which has remarkable similarities to the FTX collapse. Whilst smaller in scale, over $2.5 Billion worth of perpetual futures contracts were closed out in a single day. This represents a -24.5% decline, and a complete unwind of all leverage build up through July-August.

A total of $230M in long positions were liquidated and forced closed in a few hours, making for the largest liquidation event since LUNA collapsed in May 2022. This liquidation event was larger in magnitude than the short squeeze which kicked off the 2023 rally in Jan, suggesting it may have trend changing potential.

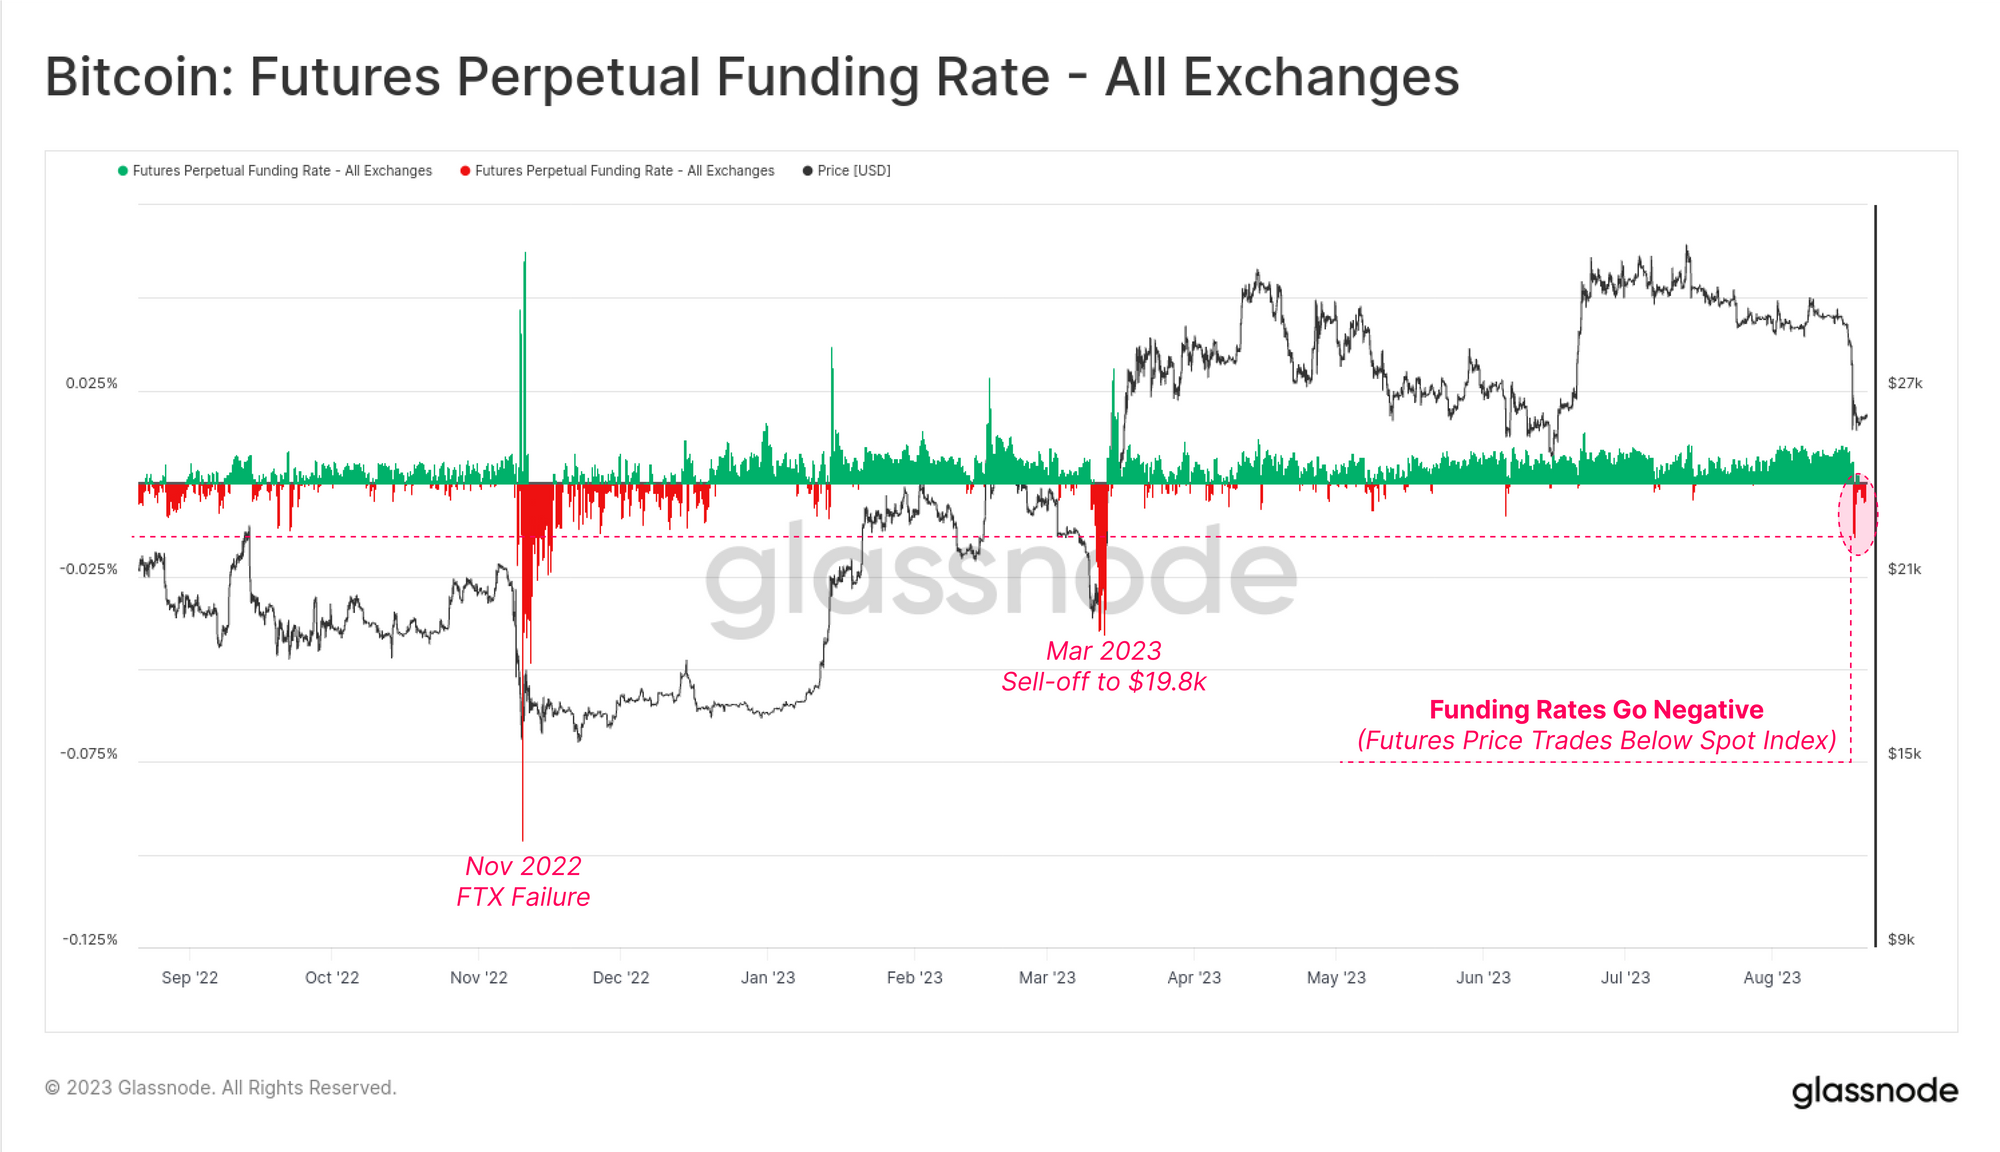
Futures markets also experienced a negative dislocation due to the forced selling, driving futures prices well below the spot market index. Funding rates went negative to create an incentive for market makers to open long positions and arbitrage price differentials.
This is the deepest negative funding rate since the March sell-off to $19.8k, although the dislocation last week is smaller in magnitude. In general, this suggests that the leverage build-up and subsequent deleveraging in futures markets was a primary factor driving this sell-off.
📊
Top Heavy Spot Markets
A concept we revised last week (WoC 33) was the notion of a ‘top heavy market’, where significant volumes of spot supply has a cost basis near or above the current price. When the BTC price moves suddenly, we can see the magnitude of supply that falls into loss via changes in the Percent Supply in Profit metric.
Here we see that 12.8% (2.48M BTC) of the supply fell into an unrealized loss this week, setting a lower low on this metric. This suggests that ‘top heaviness’ in spot markets may also be a factor in play.

If we look to the response by Long-Term Holders (LTHs), we can see that there is almost no response. The LTH cohort did not meaningfully increase volume sent to exchanges, and their aggregate balance actually ticked up to a new ATH this week.
Thus, we can conclude Short-Term Holders (STHs) are more relevant to assess.

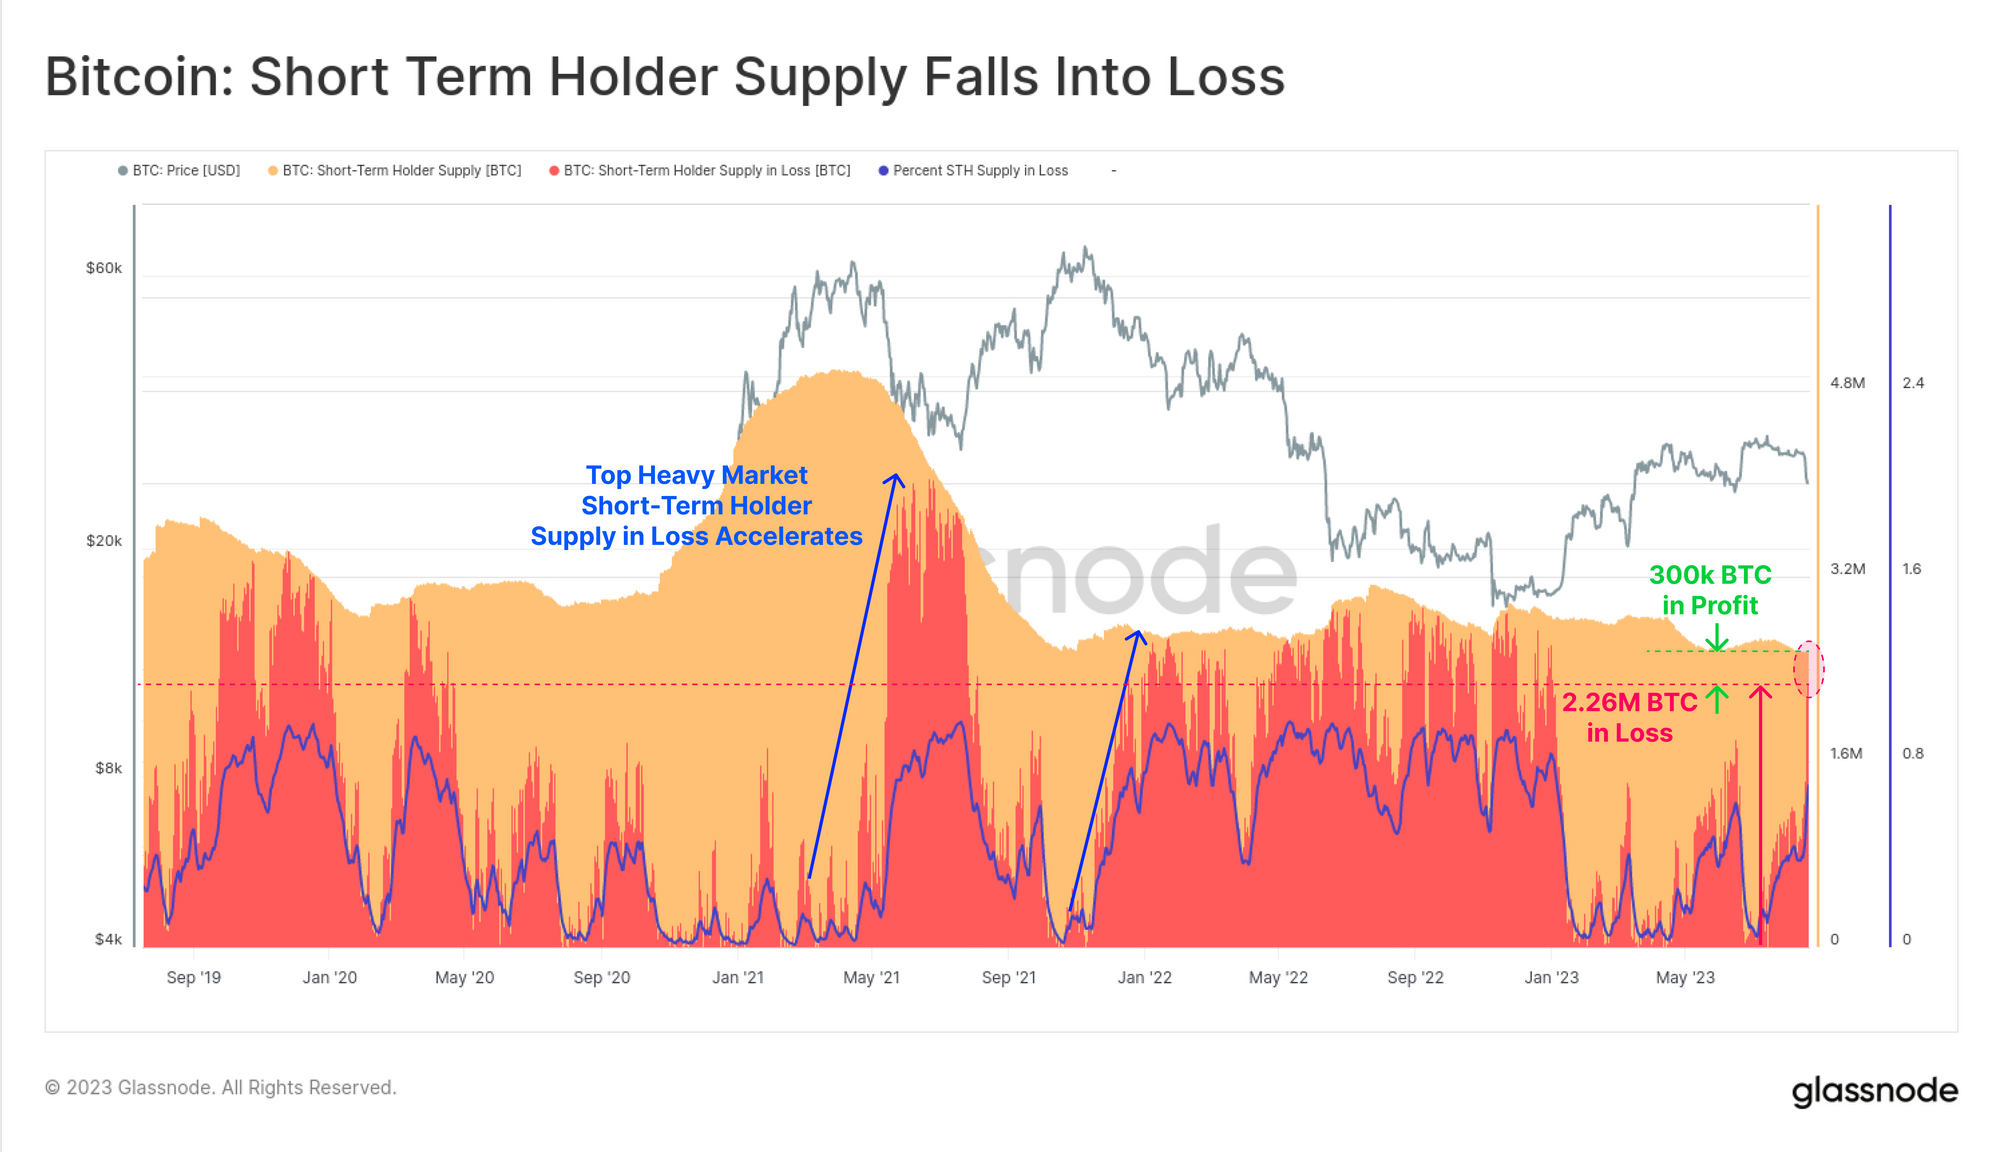
With LTH supply at ATH, we can also see that STH supply remains at multi-year lows. However, the chart below overlays the proportion of STH supply which is held at an unrealized loss.
Note how sharp upticks in STH Supply in Loss tend to follow ‘top heavy markets’ such as May 2021, Dec 2021, and again this week. Out of the 2.56M BTC held by STHs, only 300k BTC (11.7%) is still in profit.
The next chart shows the Profit or Loss Bias (dominance) of STH volumes flowing into exchanges. We can see a steady decline in profit dominance as the 2023 rally progressed, as more STHs acquired coins with an increasingly elevated cost basis.
This week we saw the largest loss dominance reading since the March sell-off to $19.8k. This suggests that the STH cohort are both largely underwater on their holdings, and increasingly price sensitive.

Metric Deep Dive: Realized Loss Momentum
Finally, we will close out with one of the more advanced and responsive tools under development by the Glassnode team. The goal of this tool is to identify significant market inflection points, such as ‘top or bottom heavy markets’. It is designed as follows:
- During macro up-trends, investors generally become increasingly profitable, with losses becoming less frequent (and vice versa in downtrends).
- This results the ratio between Realized Profit/Loss (P/L) remaining above 1.0 for sustained periods of time during market up-trends. Conversely, the Loss/Profit (L/P) Ratio remains above 1.0 during downtrends.
- If we compare the P/L Ratio to its 1yr moving average, we can establish a P/L Momentum indicator 🟢 which will spike higher when profit dominance increases rapidly. This often occurs following a loss dominant regime (such as near bottom-heavy inflection points). A similar L/P Momentum 🔴 can be calculated for identifying top-heavy inflection points.
- A dominance oscillator (at the bottom of the chart) can also be constructed to provide another perspective for identifying inflection points.
The variant of this metric shown below is specifically for Short-Term Holders who are the most reactive cohort to market volatility. We can see that after several months of declining profit dominance, Loss momentum and dominance have increased meaningfully. False signals do occur such as during the March 2023 correction, and these have historically recovered quickly.
However, sustained declines have also preceded more violent downtrends such as in May and Dec 2021, making this weeks sell-off one to keep a close eye on.
📊

Summary and Conclusions
The Bitcoin market was shaken violently awake this week, selling off -7.2% on 17-Aug, making for the largest single day down move YTD. Many indicators point to a future market deleveraging as the most probable driver, with options traders also forced to rethink and reprice volatility premiums.
Long-Term Holders remain largely unfazed and unresponsive, which is a typical behavior pattern of this cohort during bear market hangover periods. Short-Term Holders however are of greater interest, with 88.3% of their held supply (2.26M BTC) now held at an unrealized loss. This is compounded by an acceleration in STH realized losses being sent to exchanges, as well as the loss of key technical moving average support, putting the bulls on the back-foot.
- SEO Powered Content & PR Distribution. Get Amplified Today.
- PlatoData.Network Vertical Generative Ai. Empower Yourself. Access Here.
- PlatoAiStream. Web3 Intelligence. Knowledge Amplified. Access Here.
- PlatoESG. Automotive / EVs, Carbon, CleanTech, Energy, Environment, Solar, Waste Management. Access Here.
- PlatoHealth. Biotech and Clinical Trials Intelligence. Access Here.
- ChartPrime. Elevate your Trading Game with ChartPrime. Access Here.
- BlockOffsets. Modernizing Environmental Offset Ownership. Access Here.
- Source: https://insights.glassnode.com/the-week-onchain-week-34-2023/

