Nobody could argue that 2022 was anything but a bear market. After Bitcoin reached an ATH in November of 2021 we saw the bear market develop in classic fashion by losing support at key technical levels. While the bear was playing out in somewhat predictable fashion, the market was caught off guard by the events that led to the FTX crash in November 2022. Because the contagion from FTX had a devastating ripple effect that was felt by the largest institutions with crypto exposure as well as banks, I actually expected prices to fall even lower.
At the time, fear and fighting among institutional players like Galaxy, Gemini and Grayscale (under DCG) who were among SBF’s largest institutional victims added to the concern that price would grind down towards the lower teens, yet somewhat remarkably and perhaps not so coincidentally on January 1, 2023 Bitcoin started to rally. What was first considered weekend whale games evolved long past the weekend, and in fact, through Q1/2023 I identified an entity on FireCharts which I nicknamed “Notorious B.I.D.” that was double stacking large blocks of bid liquidity to push price higher. There was a pattern to the behavior that made it somewhat predictable and tradable. Those moves were well documented in my X feed during that period of time. Once price reached $25k that entity disappeared. Even without the help of that manipulation pushing price up, and despite the fact that the macroeconomic situation was horrible, the geopolitical situation went from bad to worse and the US political situation evolved from a dysfunctional sh*t show to a full blown circus, the market continued to rally.
Now, nearly 12 months and > 150% from the day the rally began, the debate between bulls and bears over whether this is a confirmed bull market or a sequence of bear market distribution rallies literally continues today. While it’s understandable that someone could look at 150% and immediately assume bull market, it does require a deeper understanding of what distribution and accumulation look like. From my view, that still isn’t as clear as one would expect. Historically, the Purple Class of Whales with orders in the $100k – $1M range have had the most influence over BTC price direction. The order flow data I’ve been monitoring on Binance shows that through most of the year they (along with larger MegaWhales) have been buying dips and distributing significantly more than they bought on those dips on the uptrends that followed.
Only recently have we seen an uptick that could be an indication that the trend is shifting. Parallel to that, some on-chain data providers are showing an increase in the number of wallets holding BTC which is also an indication that we could be transitioning from a distribution phase to an accumulation phase and I’m looking for more clear evidence of that. One of the things I look for to get a sense of that is bid liquidity. I believe that “Liquidity = Sentiment,” and it’s no secret that order books have been thin on both sides of price through most of the year, however in the last 3 weeks or so, we’ve started seeing more institutional sized bid ladders coming into the order book and that fact supports a bullish thesis, as long as they don’t dump through the next pump.
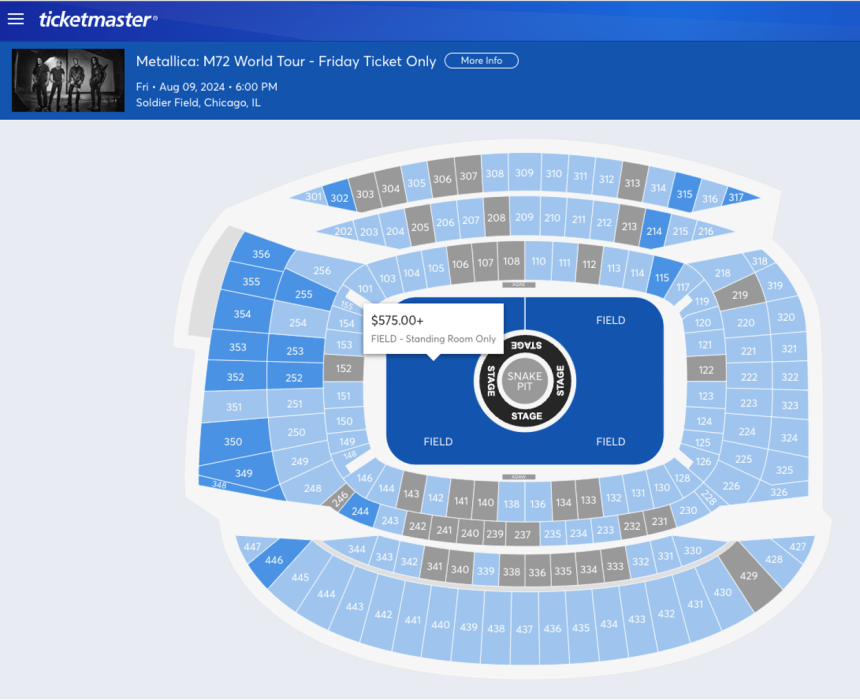
With all of the above in mind, there are most certainly turns and twists that investors should look out for. Sure we are starting to see some improvements on the U.S. inflation and unemployment numbers, but something in those reports doesn’t jive with reality. For most middle and lower income Americans, credit card debt is climbing to new highs, rents have soared, home ownership is unattainable, grocery prices are high and a Metallica “Standing Room Only” Field ticket is $575. So in my mind, we still have a percolating macroeconomic problem and the geopolitical and U.S. political issues seem to get worse by the day.
Aside from that, the RSI has been over cooked for an extended period of time and we just had 8 consecutive green weekly candles. Both of those factors have historically led to corrections. I could give you the “History doesn’t have to repeat itself…” spiel or I can show you what historically happens after moves like this and let you decide.
Another potential twist to consider is that the current PA has a striking resemblance to the first leg of the 2019 rally that turned out to be a Fib retracement, that ultimately got rejected from the top of the Golden Pocket at .618 Fib. That led to a 53% correction before the Covid Crash took it down more than 70% from the .618 Fib.
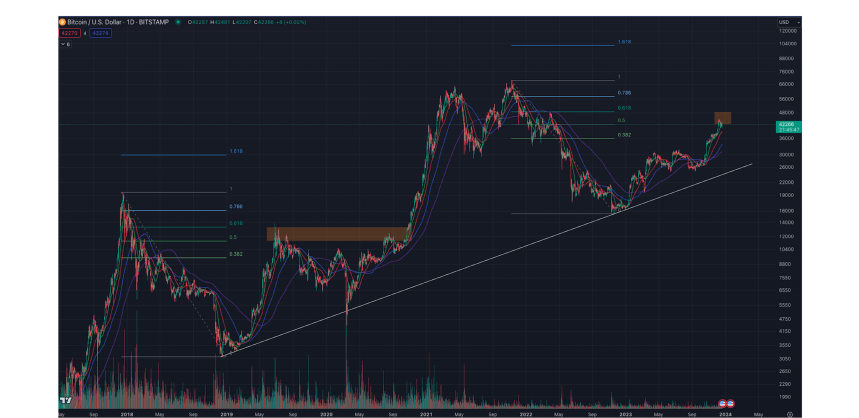
At this stage, I’d be surprised to see a downside move that deep without the aid of a Black Swan, but we are currently having some interaction with the Golden Pocket that seems familiar. While it is reasonable to expect some resistance entering and exiting the Golden Pocket, there is one very weird twist to what we are seeing and that is a strange pattern I’ve noticed occurring on or around December 17th. Every year since 2017 there has been a move on December 17th that had Macro implications. The only exception to that is last year when it happened on December 20th. On each occasion the price action led to a macro breakout or breakdown. It’s too soon to tell if this move will validate the pattern on the day of writing (Dec 19th), but on the 17th we saw BTC get rejected from the lower end of the Golden Pocket and also lose the 21-Day moving average. Price has been flirting with both of those levels ever since so we’ll have to wait to see how it plays out over time. Aside from those things I’m watching the upcoming ETF window very closely. I think that the market is numb to SEC delays on these decisions, but there is so much anticipation that this time we’ll see an approval, that a flat out rejection has the potential to be the catalyst that triggers a correction.
Regardless of where you side on whether we are or are not in a confirmed bull market, we’re seeing a lot of evidence that if we are not in it, we’re close to it. If you’re a long term investor and you haven’t already started building a position, it’s a good time to identify some targets to start scaling into one. This of course depends on your time horizon and risk appetite, but if you have a long term outlook and 6 figure targets for BTC it’s still early enough to get in, but it’s also a good idea to save some dry powder for a correction because in my opinion, it’s not a matter of if it will come, but when.
Q: Right now, we are seeing Bitcoin reach new highs. Do you think we are in the early days of a full bull run? What has changed in the market that enabled the current price action; is it the Bitcoin spot ETF or the US Fed hinting at a loser policy or the upcoming Halving? What is the big narrative that will go on in 2024?
Despite the ongoing debate between bulls and bears over whether or not we’ve been in a bull market, I can say that despite the uptrend, there has been no clear confirmation that we’ve been in a bull market through most of the year. However, the fact that we’ve recently started to see more institutional sized bid ladders coming into the order book along with the on-chain data that indicates more wallets holding for longer and the recent buying after the R/S flip at $40k are indications that we may be on the verge of a breakout.
There’s no doubt in my mind that a lot of the momentum we’ve been seeing is related to the next ETF decision window opening January 5-10 and the April 2024 Halving. The FED’s recent decision to pause rate hikes and hint at a pivot to cuts in 2024 certainly added fuel to that momentum that pushed price above $40k. In typical crypto form, we also had some help in late October through early December when I noticed some familiar patterns in the order book. I can’t confirm with absolute certainty if it was the Notorious B.I.D. spoofer we saw in Q1 returned, but it was the same game I identified through Q1 being executed and there is no question that it helped push price up through the $35k – $40k range before it disappeared.
(…) As much as I’d like to see a correction come before we get there (the Bitcoin spot ETF decision), the market doesn’t care what I want. I would expect it to come before the Halving. Whether it comes before or after the ETF decision window closes remains to be seen. In the meantime, I’ll continue to watch order book and order flow data and trade what’s in front of me.
Q: Last year, we spoke about the most resilient sectors during the Crypto Winter. Which sectors and coins will likely benefit from a new Bull Run? We are seeing the Solana ecosystem bloom along with the NFT market; what trends could benefit in the coming months?
- SEO Powered Content & PR Distribution. Get Amplified Today.
- PlatoData.Network Vertical Generative Ai. Empower Yourself. Access Here.
- PlatoAiStream. Web3 Intelligence. Knowledge Amplified. Access Here.
- PlatoESG. Carbon, CleanTech, Energy, Environment, Solar, Waste Management. Access Here.
- PlatoHealth. Biotech and Clinical Trials Intelligence. Access Here.
- Source: https://www.newsbtc.com/news/a-crypto-christmas-special-with-material-indicators-past-present-and-future/

