SNEAK PEEK:
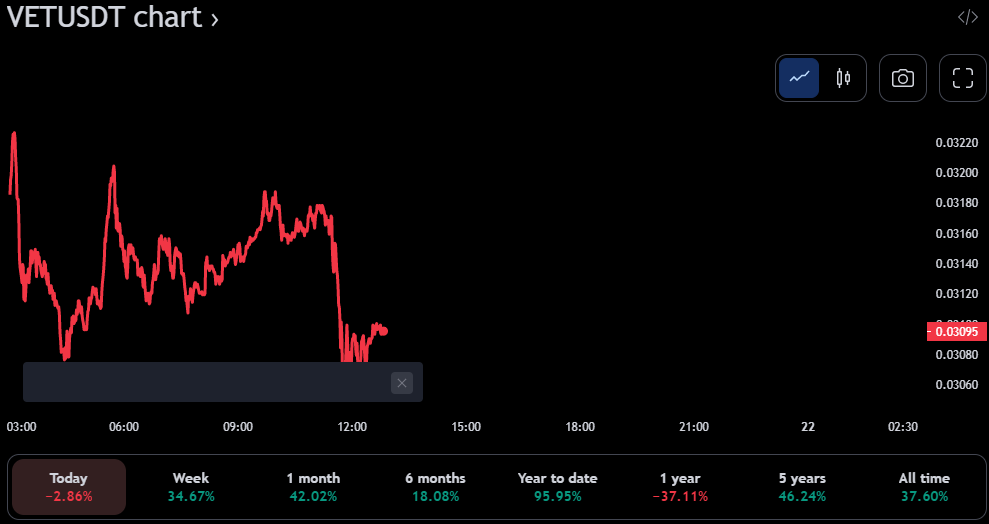
- VeChain’s (VET) bullish trend ends at a 90-day high.
- VET/USDT trades near the upper arm of the widening Bollinger band.
- RSI suggests VET/USDT may be due for a correction.
After establishing support for around $0.03057, VeChain (VET) buyers have been in command of the market for the preceding 24 hours. However, the bullish trend ended as buyers could not push the price beyond the new 90-day high of $0.03245. At the time of writing, however, the bears had triumphed, and the price had fallen by 0.73% to $0.03099.
The recession caused a drop in market capitalization and 24-hour trading volume to $2,245,833,876 and $199,642,131, respectively, from their pre-recession highs.
The 4-hour Bollinger Bands indicator shows that the VET/USDT pair has been moving laterally, with multiple failed efforts to break up or down. In addition, the Bollinger band is widening, which portends heightened volatility. The VET/USDT is trading around the upper border of the Bollinger band, which indicates that a breakout is possible. The top Bollinger band is at 0.03342, while the lower band is at 0.02576.
At a reading of 61.16 on the Relative Strength Index, investors are in the overbought zone, signaling an increased likelihood of a bearish crossover in the days ahead. Therefore, investors should keep an eye on the VET/USDT exchange rate in the following days, as this bearish crossing may signal the start of a slump.
According to the Moving Average Convergence Divergence (MACD) indicators, the exchange rate is approaching a negative divergence as the MACD line approaches the signal line. Additionally, if the MACD crosses above the signal line, the bears will assume control of the trend. At the time of writing, the MACD fluctuates around 0.00149, while the signal line is at 0.00147.
In the 24-hour chart, the Moving Average Convergence Divergence shows a more bullish outlook for the asset as the MACD line rises above the signal line. The MACD line is currently at 0.00188, while the signal line is at 0.00129.
In addition, the Bollinger bands have widened, indicating heightened market volatility. The VET/USDT currency pair is trading above the upper arm of the Bollinger bands, suggesting a potential drop if the bears take control of the market.
On the contrary, the RSI is currently at 67.52, suggesting that the market is overbought and due for a correction. Traders may want to keep an eye on the VET/USDT pair as it is trading above the upper arm of the Bollinger bands, which often precedes a reversal if bears take control of the market.
Bulls must continue to strive to convert resistance into support if bullish power is to reclaim control of the VET market.
Disclaimer: The views and opinions, as well as all the information shared in this price prediction, are published in good faith. Readers must do their research and due diligence. Any action taken by the reader is strictly at their own risk. Coin Edition and its affiliates will not be held liable for any direct or indirect damage or loss.
- SEO Powered Content & PR Distribution. Get Amplified Today.
- Platoblockchain. Web3 Metaverse Intelligence. Knowledge Amplified. Access Here.
- Source: https://investorbites.com/vechain-price-analysis-21-2/

