- BoJ Governor Ueda’s press conference is likely to be a pivotal moment in guiding market participants’ expectations toward monetary policy normalization away from negative interest rates.
- Bullish exhaustion elements were sighted as the USD/JPY rally hit the 148.40/85 key medium-term resistance.
- The 10-year JGB yield has continued to inch higher to a decade-high of 0.75% and August’s core-core Japan inflation rate remained elevated at 4.3% y/y, a 42-year high.
- The “drumbeat” has increased for a potential bearish reversal in USD/JPY, watch the key short-term support at 147.50.
This is a follow-up analysis of our prior report, “USD/JPY Technical: Aroused FX verbal intervention” published on 6 September 2023. Click here for a recap.
The USD/JPY has continued to pierce higher despite a string of verbal interventions from Japan’s Ministry of Finance officials to negate the JPY weakness as well as Bank of Japan (BoJ) Governor Ueda’s “quiet exit from ultra-easy monetary policy” comment made earlier this month.
The primary driver of USD/JPY strength has been on the US side of the equation, with relentless upmove in the longer-term 10-year US Treasury yield that broke above a key medium-term resistance of 4.46% and closed yesterday, 21 September US session at 4.50%, its highest level since November 2007 reinforced by a “higher interest rate level for a longer-period” stance undertook by the US Fed after its latest FOMC that concluded on Wednesday.
Even though BoJ has kept its policy interest rate unchanged today at -0.1% which has been widely expected, there is now an increased chance that BoJ Governor Ueda may portray an upbeat view on the inflationary situation in Japan during his press conference later today after a Nikkei Asia news report published yesterday, 21 September that highlighted the potential change of tide in Japan’s more than a decade long of deflation battle as recent comments from BoJ and government officials have hinted that the Japanese economy has hit an inflection point where it can declare victory over sticky deflation.
In addition, the latest Japan’s core-core inflation rate (excluding fresh food and energy) for August came in at an elevated level of 4.3% y/y, unchanged from July, a 42-year high. Also, BoJ has allowed the 10-year Japanese Government Bond (JGB) yield to inch higher towards its implied upper limit of 1% after its new “flexible yield curve control” policy was introduced during July’s monetary policy meeting. So far, the 10-year JGB yield has rallied to 7.6% yesterday, a 10-year high.
All in all, these observations have drummed up the beat for a potential JPY floor to negate its current medium-term bearish trend since January 2023.
Let’s now look at the USD/JPY from a technical analysis perspective.
Bullish exhaustion sighted right at 148.40/85 key medium-term resistance
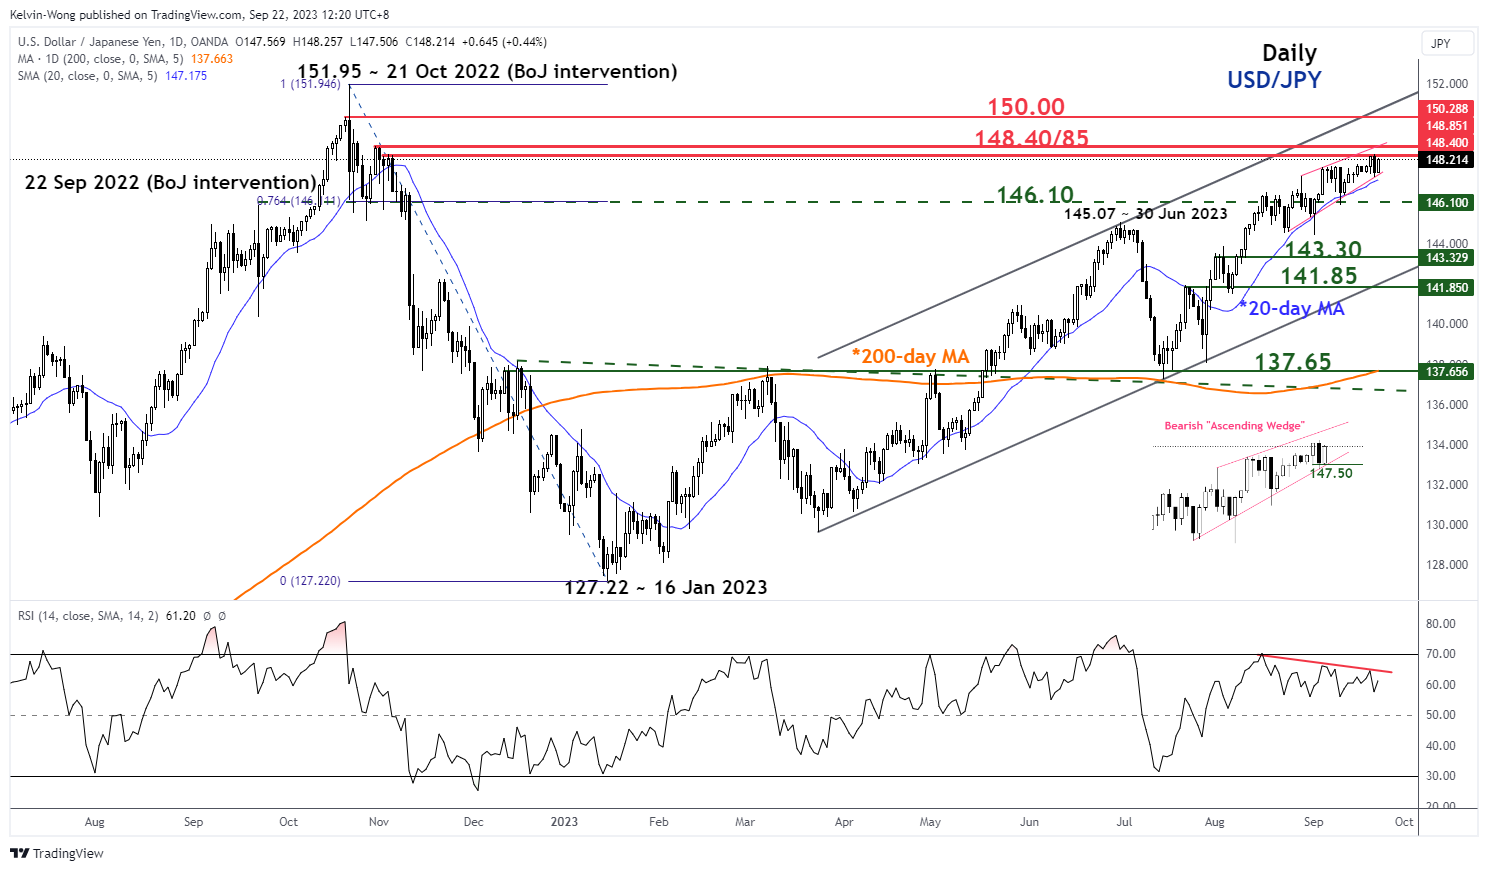
Fig 1: USD/JPY medium-term trend as of 22 Sep 2023 (Source: TradingView, click to enlarge chart)
Since its 23 August 2023 low of 144.54, the USD/JPY has been oscillating within an impending bearish “Ascending Wedge” configuration where its upper limit also coincides with the 148.85 key medium-term resistance (the highest level reached so far this week for USD/JPY was at 148.46 on Thursday, 21 September).
The “Ascending Wedge” is considered a potential bearish reversal configuration because the “higher highs” in price actions have a lesser magnitude than the “lower lows” as indicated by the slopes of the upper and lower limits of the “Ascending Wedge”.
In conjunction, the daily RSI in parallel since the start of the formation of the Ascending Wedge” on 23 August 2023 has traced out a bearish divergence condition after it hit its overbought region on 16 August 2023. These observations suggest that the medium-term upside momentum is waning which in turn supports the potential bearish reversal scenario in USD/JPY.
Watch the 147.50 key short-term support
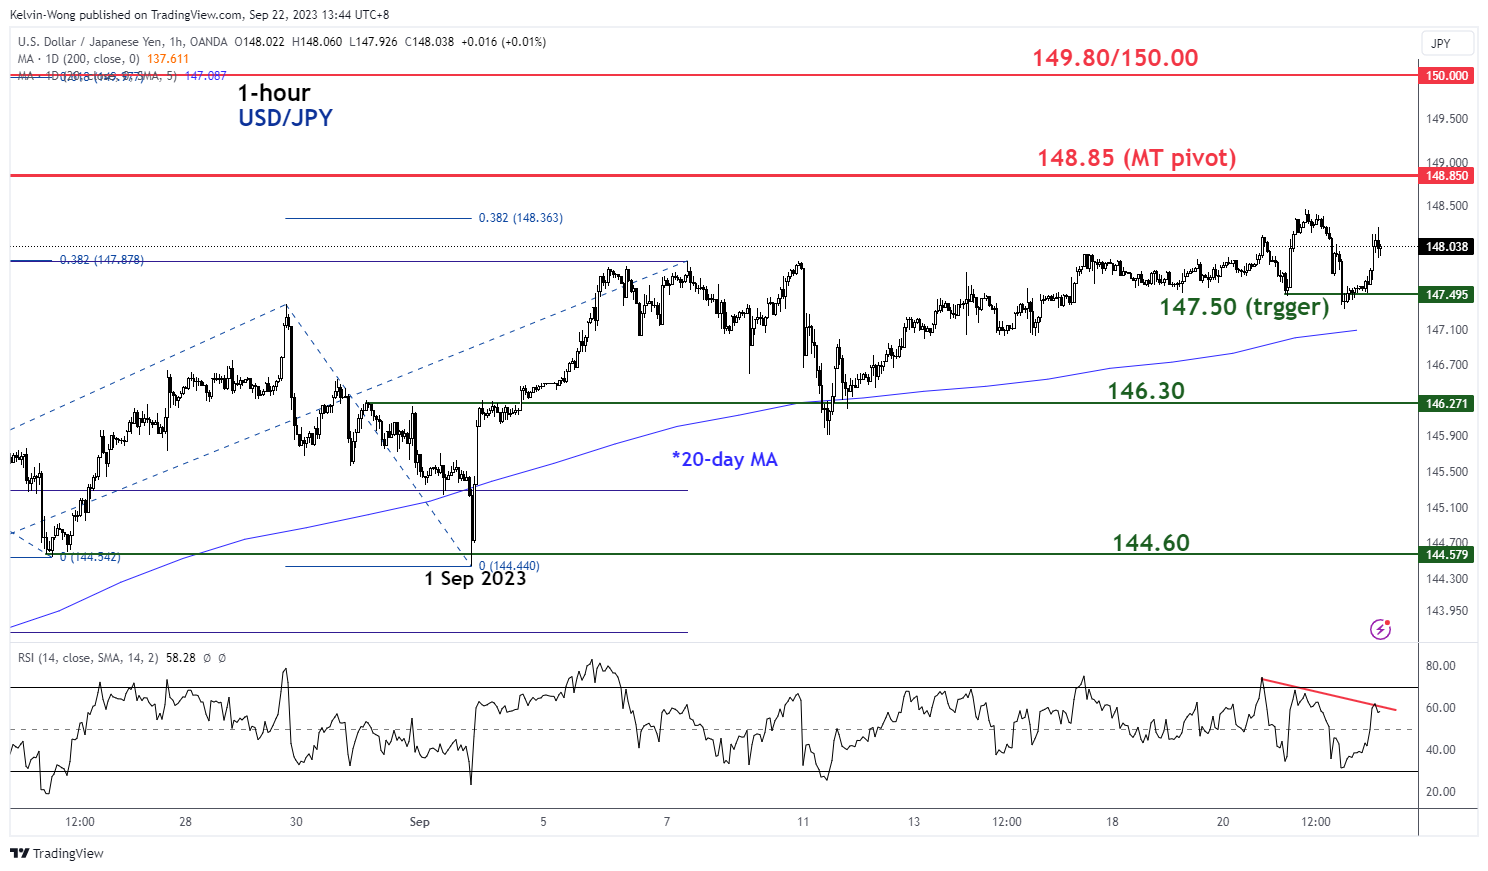
Fig 2: USD/JPY minor short-term trend as of 22 Sep 2023 (Source: TradingView, click to enlarge chart)
In the shorter term as seen on the 1-hour chart, the key support to watch will be at 147.50 which is defined by the lower limit of the bearish “Ascending Wedge” and close to the 20-day moving average.
A break below 147.50 is likely to trigger the potential bearish reversal to expose the next intermediate supports at 146.30 followed by 144.60 (minor swing lows 24 August/1 September 2023) in the first step.
On the flip side, a clearance above 148.85 invalidates the bearish reversal scenario for a squeeze up toward the major resistance of 149.80/150.00 (21 October 2022 swing high area & psychological).
Content is for general information purposes only. It is not investment advice or a solution to buy or sell securities. Opinions are the authors; not necessarily that of OANDA Business Information & Services, Inc. or any of its affiliates, subsidiaries, officers or directors. If you would like to reproduce or redistribute any of the content found on MarketPulse, an award winning forex, commodities and global indices analysis and news site service produced by OANDA Business Information & Services, Inc., please access the RSS feed or contact us at [email protected]. Visit https://www.marketpulse.com/ to find out more about the beat of the global markets. © 2023 OANDA Business Information & Services Inc.
Latest posts by Kelvin Wong (see all)
- SEO Powered Content & PR Distribution. Get Amplified Today.
- PlatoData.Network Vertical Generative Ai. Empower Yourself. Access Here.
- PlatoAiStream. Web3 Intelligence. Knowledge Amplified. Access Here.
- PlatoESG. Carbon, CleanTech, Energy, Environment, Solar, Waste Management. Access Here.
- PlatoHealth. Biotech and Clinical Trials Intelligence. Access Here.
- Source: https://www.marketpulse.com/forex/usd-jpy-technical-148-40-85-reached-whats-next/kwong

