- The US 10-year Treasury yield has pierced above 4.06% & its 200-day moving average; a sign that recent easing liquidity conditions have started to abate.
- A 3-year low seen in the implied correlation among S&P 500 constituents may trigger an imminent spike in the VIX.
- The S&P 500 is now at risk of forming a short-term top below 4,820 resistance.
After stellar Q4 quarterly and 2023 annual performances of 11.24% and 24.23% respectively, the US S&P 500 has started 2024 on a lacklustre footing, in the past two and half weeks, it has recorded an accumulated loss of -0.64% at this time of the writing after missing just a whisker to retest its all-time high of 4,818 set on 4 January 2022 with an intraday high of 4,802 printed on last Friday, 12 January 2024.
In the past week, the prior bullish tone seen in Q4 2023 for the other major US stock indices has also tapered off; with current 2024 year-to-date losses seen in the Nasdaq 100 (-0.53%), Dow Jones Industrial Average (-1.12%), and Russell 2000 (-5.62%).
The primary driver that caused the current state of lethargic behaviour seen in the US stock indices has been a snap-back of the major easing liquidity conditions that have taken form since late October 2023.
Several Federal Reserve officials have attempted to “talk down” the current state of optimism being priced by the interest rates futures market on the magnitude and pace of the expected Fed funds rate cut cycle in 2024. In the past two months, a chance of 70% to 80% was being priced by market participants for the first rate cut of 25 basis points to be enacted on the 20 March FOMC, these odds have been reduced to 59% as of yesterday, 17 January based on data from the CME FedWatch Tool.
Also, yesterday’s upbeat US retail sales data release for December that beat expectations (5% y/y vs. 4% y/y consensus) has trimmed off some of the prior frothy dovish expectations on the pace of the projected US interest rate cut cycle for 2024.
A potential short-term corrective rebound unfolding in US 10-year Treasury yield
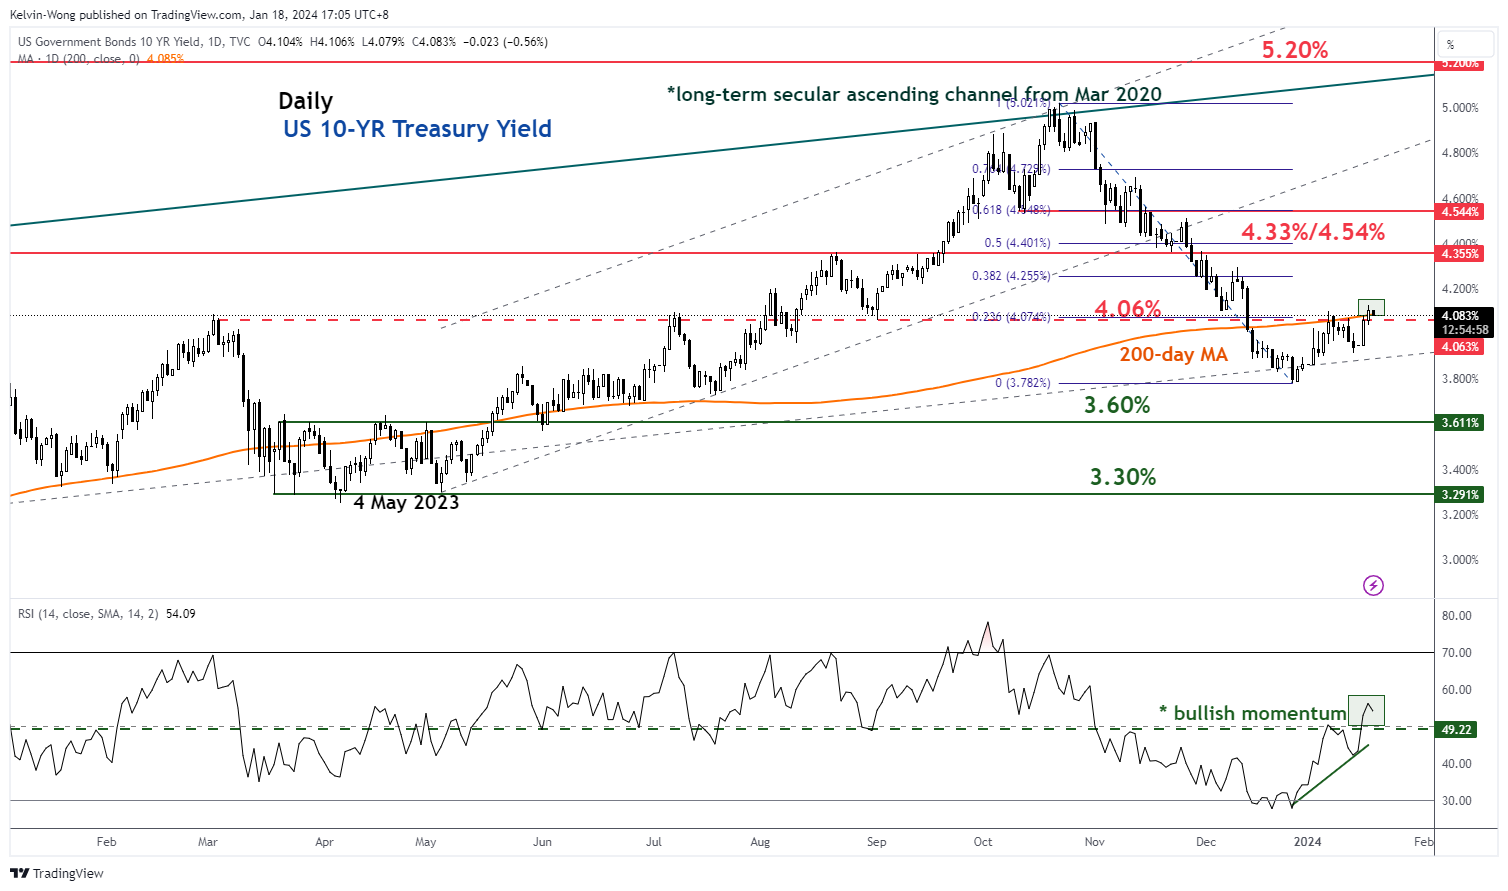
Fig 1: US Treasury 10-year yield medium-term trend as of 18 Jan 2024 (Source: TradingView, click to enlarge chart)
All in all, these factors have triggered a potential mean reversion corrective rebound phase in the US 10-year Treasury yield as it surpassed above the 4.06% key intermediate resistance and 200-day moving average.
In addition, its daily RSI momentum indicator has just cleared above the 50 level after a prior oversold condition on 20/27 December 2023 which advocates a further potential push-up in the price actions of the 10-year Treasury yield (see Fig 1).
The next intermediate resistance zone to watch will be at 4.33% to 4.54% (50%/61.8% Fibonacci retracement of the prior medium-term downtrend from 23 October 2023 high to 27 December 2023 low).
Hence, a further corrective rally in the US 10-year Treasury yield is likely to imply a tightening of liquidity conditions in the short term that can translate into a potential short-term correct decline sequence on the major US stock indices.
Current low correlation among S&P 500 constituents may lead to a spike in implied volatility
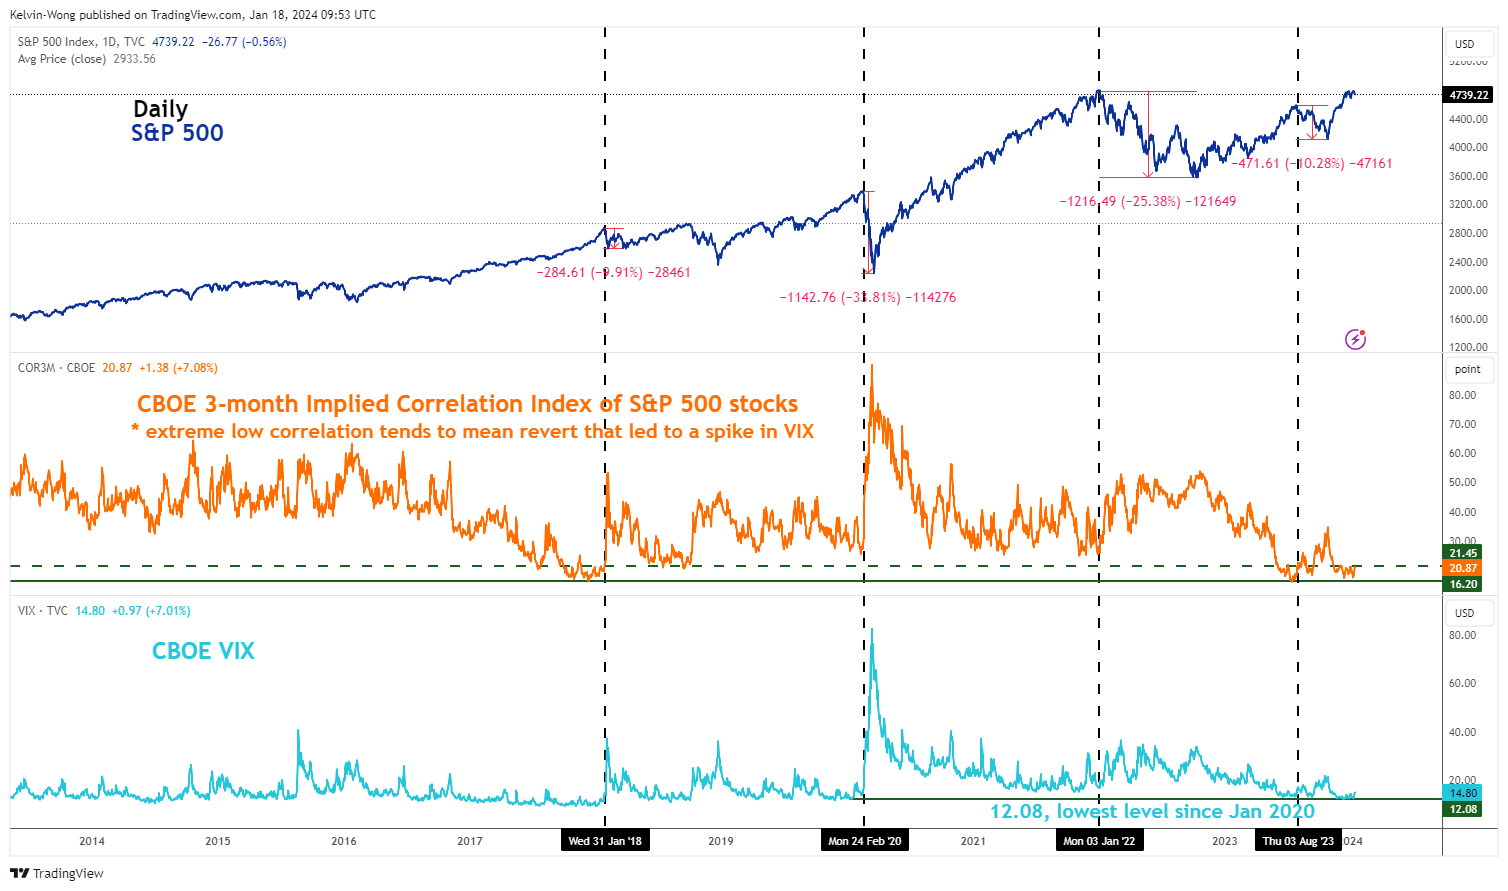
Fig 2: CBOE VIX & 3-month implied correlation index of S&P 500 constituents as of 17 Jan 2024 (Source: TradingView, click to enlarge chart)
Another interesting point to note is the recent plunge in the VIX (implied volatility of the S&P) to a 3-year low of 12.08 on 12 December 2023 which in turn has coincided with market participants’ perceptions of future low correlation readings (higher dispersion of returns on the average) of the US S&P 500 index constituents.
The CBOE 3-month Implied Correlation Index measures the 3-month expected correlation across the top 50 value-weighted S&P 500 constituents which has slipped to a low reading of 17.10 on 13 December 2023 which is close to a 6-year low of 16.20 that was met recently on 18 July 2023 (see Fig 2).
A relative “low calm” level of the CBOE 3-month Implied Correlation Index is likely not going to last forever. Based on past occurrences, a break above 21.45 on the CBOE 3-month Implied Correlation Index after a prior low depressed level has led to a spike in the VIX which in turn saw a decline of -10% in the S&P 500 from January 2018 to March 2018 and most recently a loss of -10.3% from August 2023 to October 2023.
S&P 500 may have formed a short-term top below 4,820
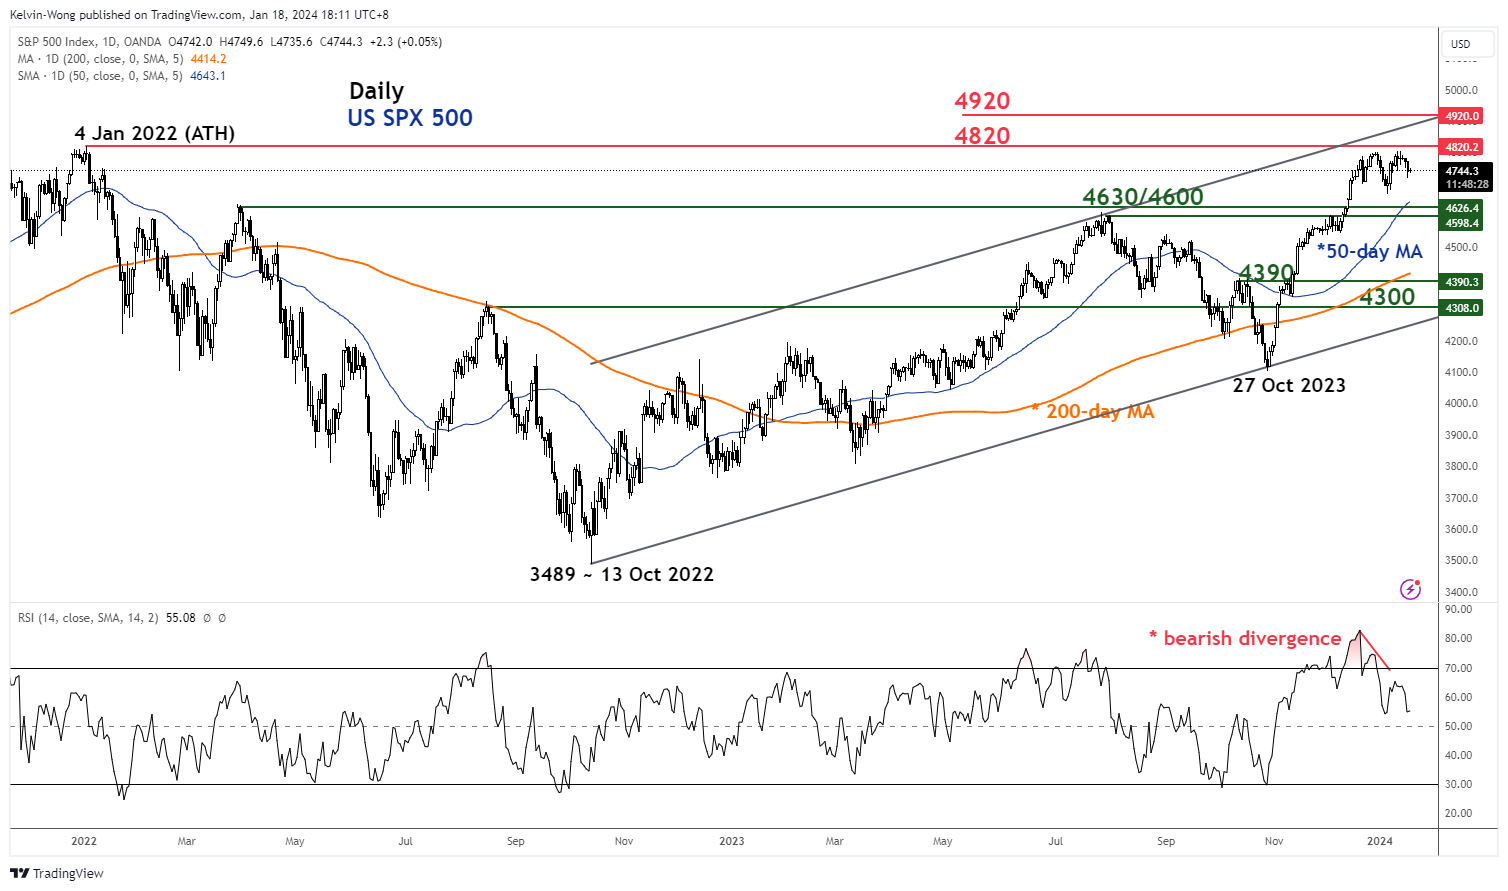
Fig 3: US SPX 500 medium-term & major trends as of 18 Jan 2024 (Source: TradingView, click to enlarge chart)
The bullish momentum of the S&P 500 from the end of October 2023 may have lost its inertia to support higher price actions of the S&P 500 going forward at this juncture.
The daily RSI momentum indicator has traced out a bearish divergence condition on 28 December 2023 and exited its overbought region which suggests that the S&P 500 is vulnerable to at least a short-term corrective decline to retrace a portion of the recent medium-term uptrend phase from 27 October 2023 low to 12 January 2024 high (see Fig 3).
The medium-term support zone to watch for the potential corrective decline will be at 4,630/4,600 which also confluences with the upward sloping 50-day moving average.
On the other flip side, a clearance above 4,820 is likely to revive the bullish tone to see the first major resistance coming in at 4,920 (a cluster of Fibonacci extension levels and the upper boundary of the major ascending channel from 13 October 2022 low).
Content is for general information purposes only. It is not investment advice or a solution to buy or sell securities. Opinions are the authors; not necessarily that of OANDA Business Information & Services, Inc. or any of its affiliates, subsidiaries, officers or directors. If you would like to reproduce or redistribute any of the content found on MarketPulse, an award winning forex, commodities and global indices analysis and news site service produced by OANDA Business Information & Services, Inc., please access the RSS feed or contact us at [email protected]. Visit https://www.marketpulse.com/ to find out more about the beat of the global markets. © 2023 OANDA Business Information & Services Inc.
Latest posts by Kelvin Wong (see all)
- SEO Powered Content & PR Distribution. Get Amplified Today.
- PlatoData.Network Vertical Generative Ai. Empower Yourself. Access Here.
- PlatoAiStream. Web3 Intelligence. Knowledge Amplified. Access Here.
- PlatoESG. Carbon, CleanTech, Energy, Environment, Solar, Waste Management. Access Here.
- PlatoHealth. Biotech and Clinical Trials Intelligence. Access Here.
- Source: https://www.marketpulse.com/indices/us-spx-500-bulls-are-getting-lethargic-and-at-risk-of-a-minor-corrective-decline/kwong

