Executive Summary
- The successful SEC approval of ten new spot BTC ETF products set the scene for a characteristically chaotic week for Bitcoin investors.
- BTC prices set new multi-year highs, followed by YTD lows, as the market sold off -18% over the weekend. This was driven by both derivatives leverage and spot profit taking.
- Several indicators reached levels where past cycles found meaningful resistance, and was highlighted by ~75K BTC being spent by Long-Term Holders taking profits.
In two short weeks, 2024 has already proven to be a real roller-coaster ride for Bitcoin investors. In what was arguably the most eventful financial product launch in history, the SEC approved ten spot Bitcoin ETF products to trade in US markets.
In many ways, Bitcoin managed to pull the traditional finance world, and US regulators, into its infamous world of chaos and volatility. The ETF approvals had a false start on 9-January, after the SEC’s X-account was compromised, posting a false notice of positive approvals. BTC prices spiked to $47.2k, before quickly selling back down to $44.5k as reality set in.
A second false start occurred on 10-Jan as genuine SEC approval documents leaked from the SEC website before US markets had closed. Eventually, full confirmation was received for approval of all ten ETF products, with trading to commence on 11-Jan.
BTC prices set a new multi-year high in response, reaching just shy of $48.8k. The market then sold off -18% over the weekend, printing new YTD lows of $40.0k whilst traditional markets were closed. Bitcoin once again welcomed Wall Street to its world.

Spot ETFs Go Live
Over the first two days of trading, combined spot ETF volumes reached $7.823B, and with over $1.4B worth of AUM flowing in. This overwhelms the -$579M of outflows from the now converted GBTC ETF product, as investors reallocated after many years of poor performance during its time as a closed end fund (and with the highest ETF fee of 1.5%, lowered from 2.0%).
LATEST: With two days in the books, the Nine Newborns have taken in +$1.4b in new cash, overwhelming $GBTC‘s -$579m of outflows for net total of +$819m. $IBIT now leading pack w/ half a bil, Fidelity close second tho. The newborns’ $3.6b in trading volume on 500k indiv trades… pic.twitter.com/b7U5DjENaw
— Eric Balchunas (@EricBalchunas) January 13, 2024
Despite these outflows, GBTC remains the ETF gorilla in the room, sporting $4.166B in trade volume over the two trading sessions, accounting for ~57% of the total. It is likely that funds will continue to reshuffle in-and-around GBTC over coming weeks.
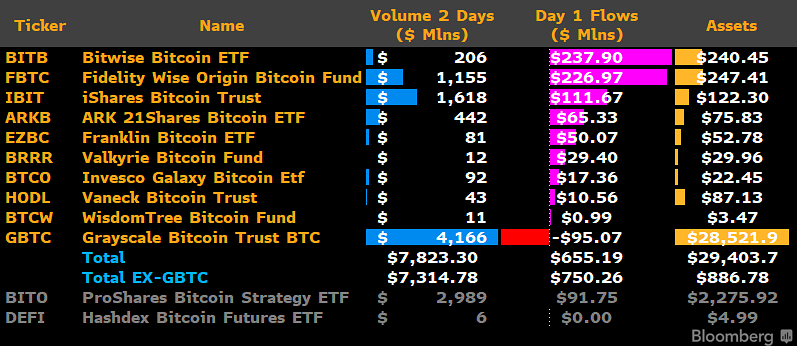
The sheer scale of GBTC relative to other ETF products can be seen in the chart below by bitcointreasuries.net. Despite the GBTC outflows, their enormous holdings of 617,080 BTC dwarf the competition, and the associated liquidity profile remains attractive for any traders and investors sensitive to liquidity and depth.

In total, US spot ETF products now hold a combined 644,860 BTC (~$27.2B) and account for 29.7% of global ETF holdings after just two trading days.
Overall, the trade volumes and AUM make this one of the largest and most significant ETF launches in history, and in many ways marks the end of the beginning of Bitcoin’s maturation and growing up phase.

A Sell-the-News Event?
Whether it is the halving, an ETF launch, or just another Thursday, Bitcoin investors love to debate whether the event was priced in, or not. Whilst there was significant volatility along the way, BTC prices remain more or less flat YTD, suggesting this particular event was priced to perfection.
Of course there are key driving factors behind the interim volatility, and both futures and options markets have seen a meaningful uptick in open interest (OI) since mid-October:
- 🟠 BTC Futures OI increased by $7.0B (+66%), with $1.1B flushed out this week.
- 🔵 BTC Options OI increased by $6.6B (+70%), seeing $2.3B closed out by both contract expiration and closed positions this week.
Open interest for both markets remain near multi-year highs, indicating that leverage is elevated, and is becoming a more dominant force in markets.

The chart below shows an oscillator for the percent change of futures open interest. This tool can be used to spot periods of rapid change in aggregate market leverage.
- 🔴 High values indicate OI has increased by +2 standard deviations.
- 🔵 Low values indicate OI has decreased by -2 standard deviations.
We can see that there was a significant deleveraging event on 3-January where almost $1.5B of OI was closed out in a single day. Conversely, OI increased significantly between 9 and 11 January as ETF speculation peaked, and prices approached $49k.
This was greeted by a weekend sell-off back down to $40k, with new owners of ETF shares introduced to Bitcoin’s 24/7 trading environment.

Perpetual funding rates have also maintained a strong positive bias, indicating leveraged traders are net long, and paying the short-side annualized yields exceeding +50% at times. We can also see the distinct phase shift which occurred in mid-October, whereby funding rates shifted from a structure of oscillating around neutral, to consistently positive.
Funding rates have cooled off this week, but do remain positive overall.

Options implied volatility has also reversed since mid-October, spiking higher during the week’s chaotic events. Implied volatility has been in a multi-year decline since May 2021, as interest waned during the bear market. It is also noteworthy that options market infrastructure, liquidity and depth has matured significantly in 2023, with open interest now on par with futures markets (see WoC-51-2023).
This downtrend appears to have reversed in the near-term, with IV more than tripling since the low of ~30% in October, to over 97% this week. With spot ETF products opening new doors for both institutional and retail capital, it is likely the volatility profile of Bitcoin will also start to evolve.

Old Coins, New Hands
It is common for holders of long-dormant coins to respond during major market events. This includes periods when the market sets new ATHs, around cycle tops and bottoms, and during large shifts in market structure (e.g. Mt Gox, Halvings, and now the launch of spot ETFs).
The degree of Unrealized Profit and Loss held by these Long-Term Holders can be measured by LTH-NUPL. This metric reached 0.55 this week, which is meaningfully positive, and puts the average long-term investor at a 55% unrealized profit.
This is also a level where the Bitcoin bulls have met meaningful resistance in prior cycles.

Long-Term Holder Supply has also come ever-so-slightly off its ATH, declining by ~75k BTC since November as older coins are spent to take profits.
Whilst 75k BTC is a meaningful sum, it should also be viewed within the context of total LTH supply accounting for a whopping 76.3% of the circulating coin supply. The inverse measure, Short-Term Holder supply, is only just ticking up off all-time-lows as this spending takes place (covered in WoC-46-2023).
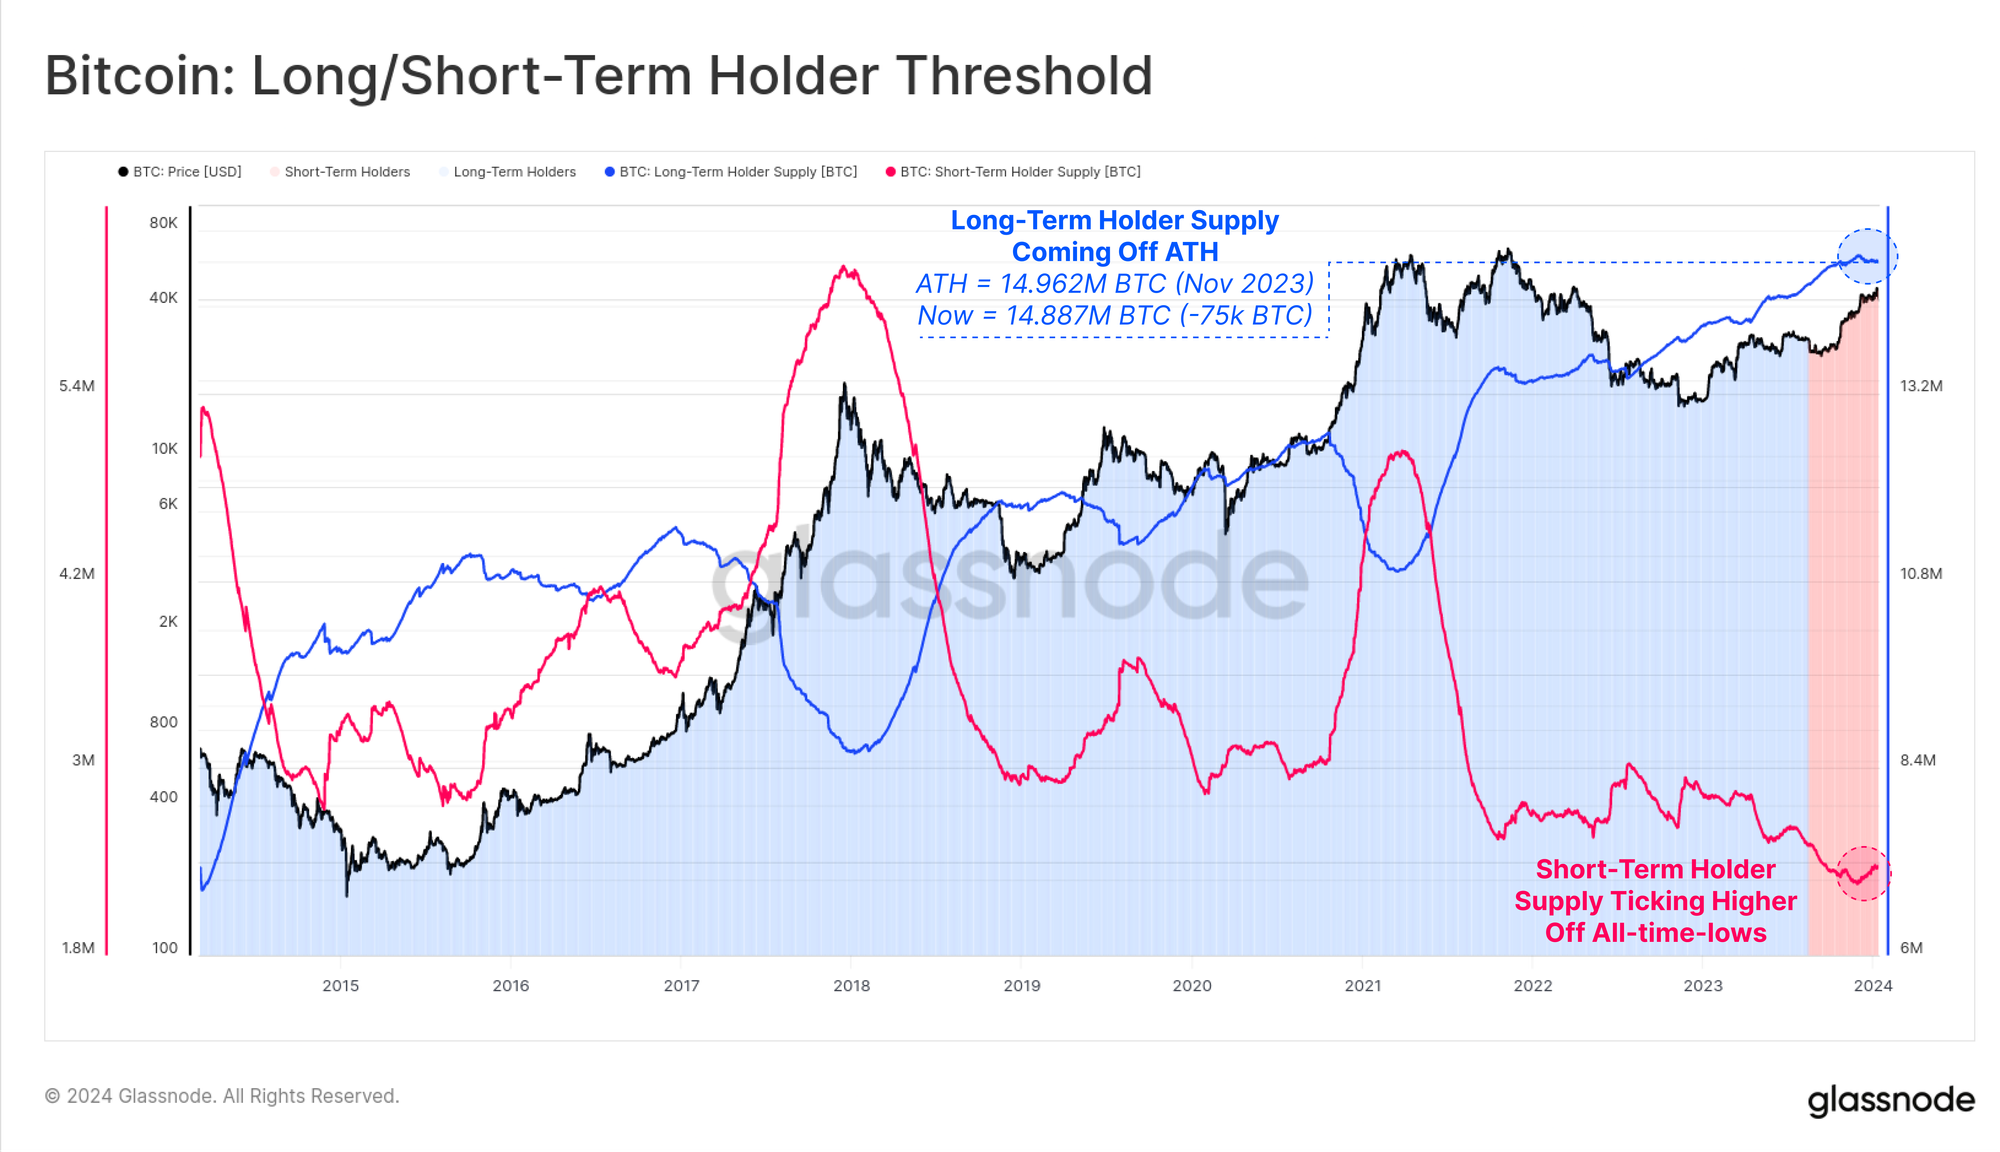
With that said, the amount of spending by these older hands is statistically significant, resulting in a +1 standard deviation increase in Revived Supply (spent coins aged 1yr+).
As we can see in the chart below, such events are relatively infrequent, however often align with up-trending markets meeting meaningful resistance.

As these older coins are spent back into liquid circulation, they contribute to what is now the largest profit taking event since the November 2021 ATH. The Realized Profit peak for this cycle was set on 4-Jan, with over $1.3B/day in profit locked in as coins change hands at a higher cost basis.
Profit taking is par for the course during a market uptrend, and the real question is whether the inflow of new demand will be sufficient to soak it all up.

Summary and Conclusions
The last week was historic in both a literal and a figurative sense. The scale of these new spot Bitcoin ETFs set new records, and a decade of hard work by the industry finally reached fruition. After more than a decade of hard work, against a backdrop of significant political, regulatory, and financial headwinds, the spot ETF ball has finally reached the end-zone.
It is somewhat poetic that this suite of spot Bitcoin ETFs started trading 15-years to the day since Hal Finney first tweeted Running bitcoin on 11-Jan-2009. The first ever Bitcoin transaction between Satoshi and Hal occurred the next day on 12-Jan-2009.
Several metrics in both on-chain and derivatives domains suggest that a non-trivial portion of Bitcoin investors did treat this as a sell-the-news event. The key question ahead is whether the inflow of demand from the ETFs, or in anticipation of the halving in April, or by the humble and reliable HODLers, will be sufficient to push through this resistance.
The ETFs may have been priced in, but for how long?
Disclaimer: This report does not provide any investment advice. All data is provided for information and educational purposes only. No investment decision shall be based on the information provided here and you are solely responsible for your own investment decisions.
Exchange balances presented are derived from Glassnode’s comprehensive database of address labels, which are amassed through both officially published exchange information and proprietary clustering algorithms. While we strive to ensure the utmost accuracy in representing exchange balances, it is important to note that these figures might not always encapsulate the entirety of an exchange’s reserves, particularly when exchanges refrain from disclosing their official addresses. We urge users to exercise caution and discretion when utilizing these metrics. Glassnode shall not be held responsible for any discrepancies or potential inaccuracies. Please read our Transparency Notice when using exchange data.

- SEO Powered Content & PR Distribution. Get Amplified Today.
- PlatoData.Network Vertical Generative Ai. Empower Yourself. Access Here.
- PlatoAiStream. Web3 Intelligence. Knowledge Amplified. Access Here.
- PlatoESG. Carbon, CleanTech, Energy, Environment, Solar, Waste Management. Access Here.
- PlatoHealth. Biotech and Clinical Trials Intelligence. Access Here.
- Source: https://insights.glassnode.com/the-week-onchain-week-03-2024/

