
Published 3 hours ago
advertisement
PEPE Price Prediction: The trending Meme cryptocurrency PEPE recorded remarkable growth this month as more and more crypto exchanges announced their listing very recently. On March 5th, the parabolic growth in this memecoin marked a new All time high of $0.0000049 and reverted immediately for a correction phase. Anyhow, after massive growth, this retracement was not surprising as it may confirm price sustainability at higher levels and offer a dip opportunity to interested traders.
Key Points:
- The correction phase above the 50% FIB level indicates the bullish momentum is healthy to prolong the price rally
- A bullish breakout from the flag pattern offers a long entry opportunity to traders.
- The intraday trading volume in the PEPE is $1.42 Billion, indicating a 292.5% gain.
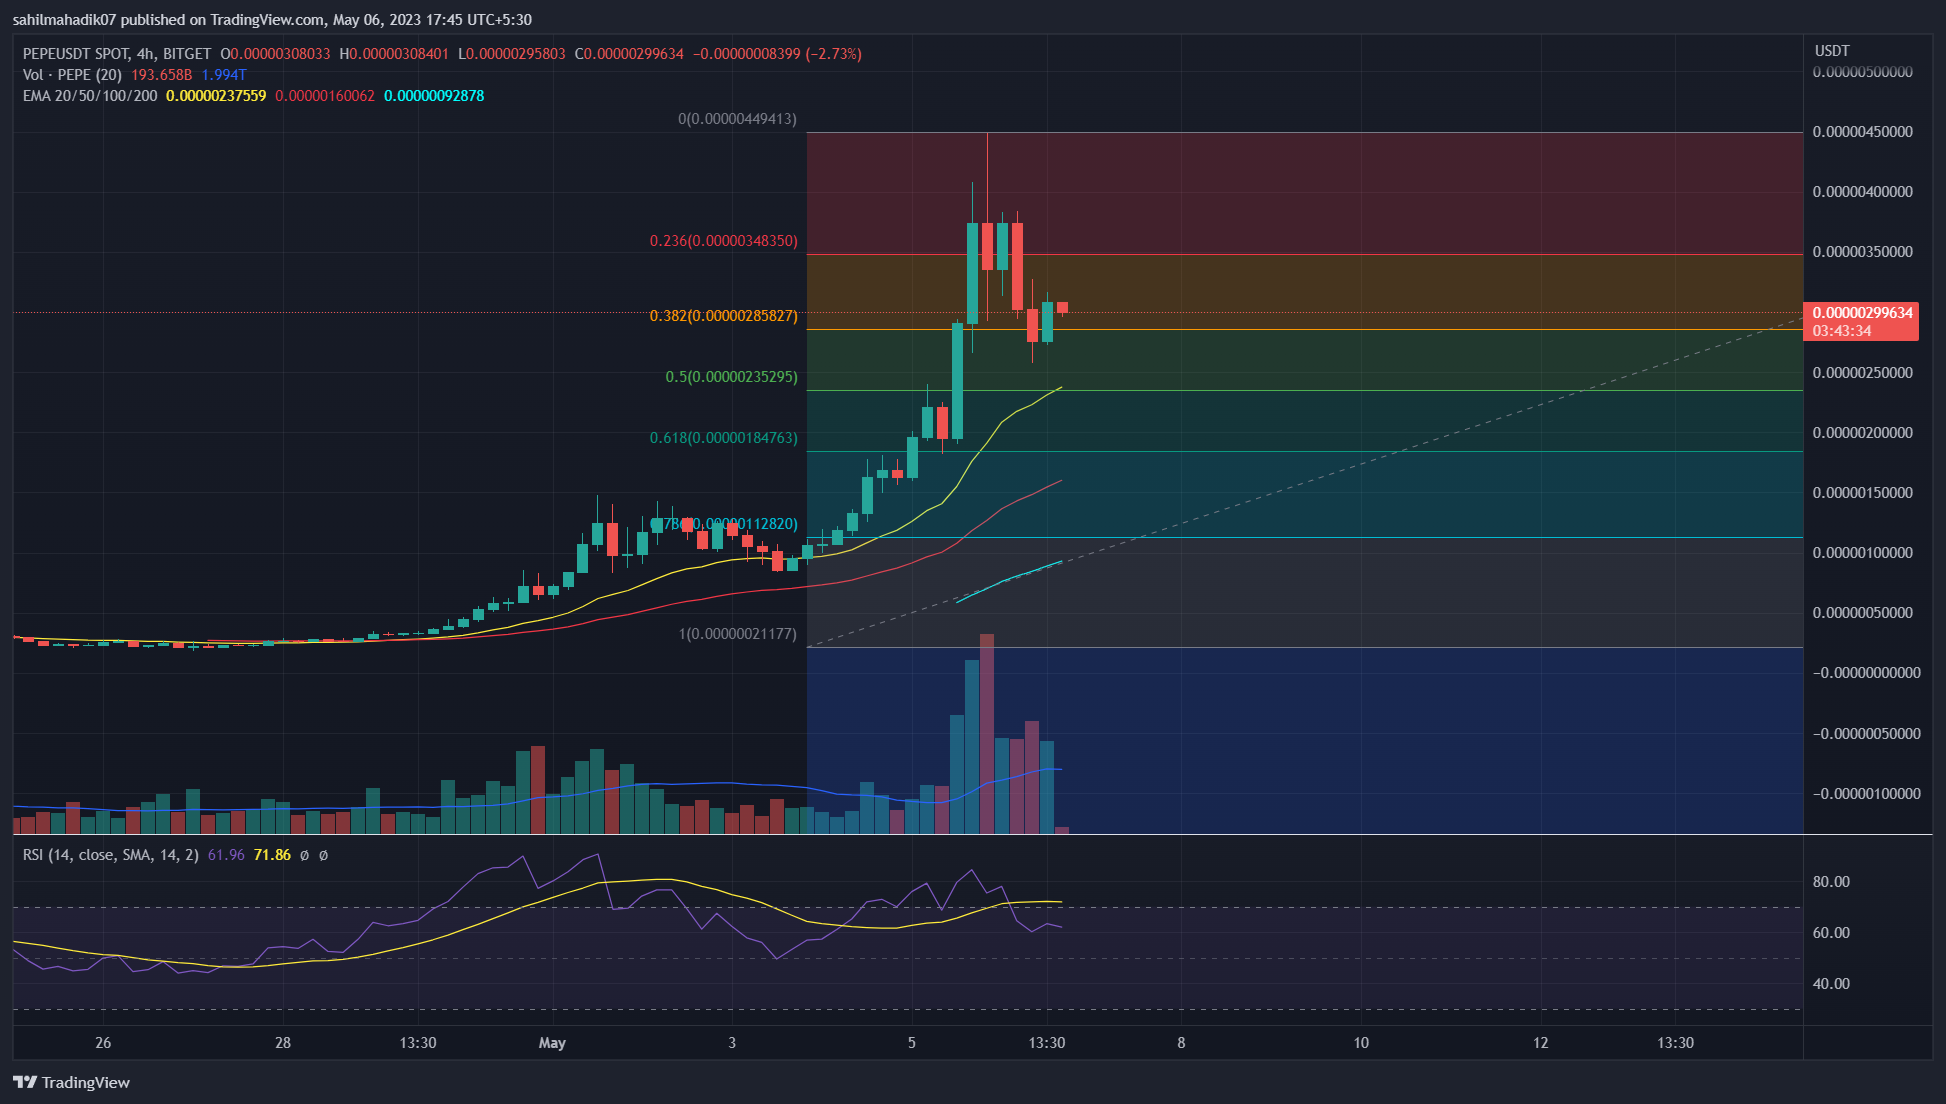
Source- Tradingview
In the 4-hour time frame chart, the PEPE price showed a high wick rejection at the new ATH of $0.0000049, indicating the exhausted bullish momentum. The resulting correction tumbled the Pepecoin price by nearly 32% and plunged it to the current price of $0.0000030.
Trending Stories
However, this pullback is still above the 50% Fibonacci retracement indicating the overall market trend is bullish.
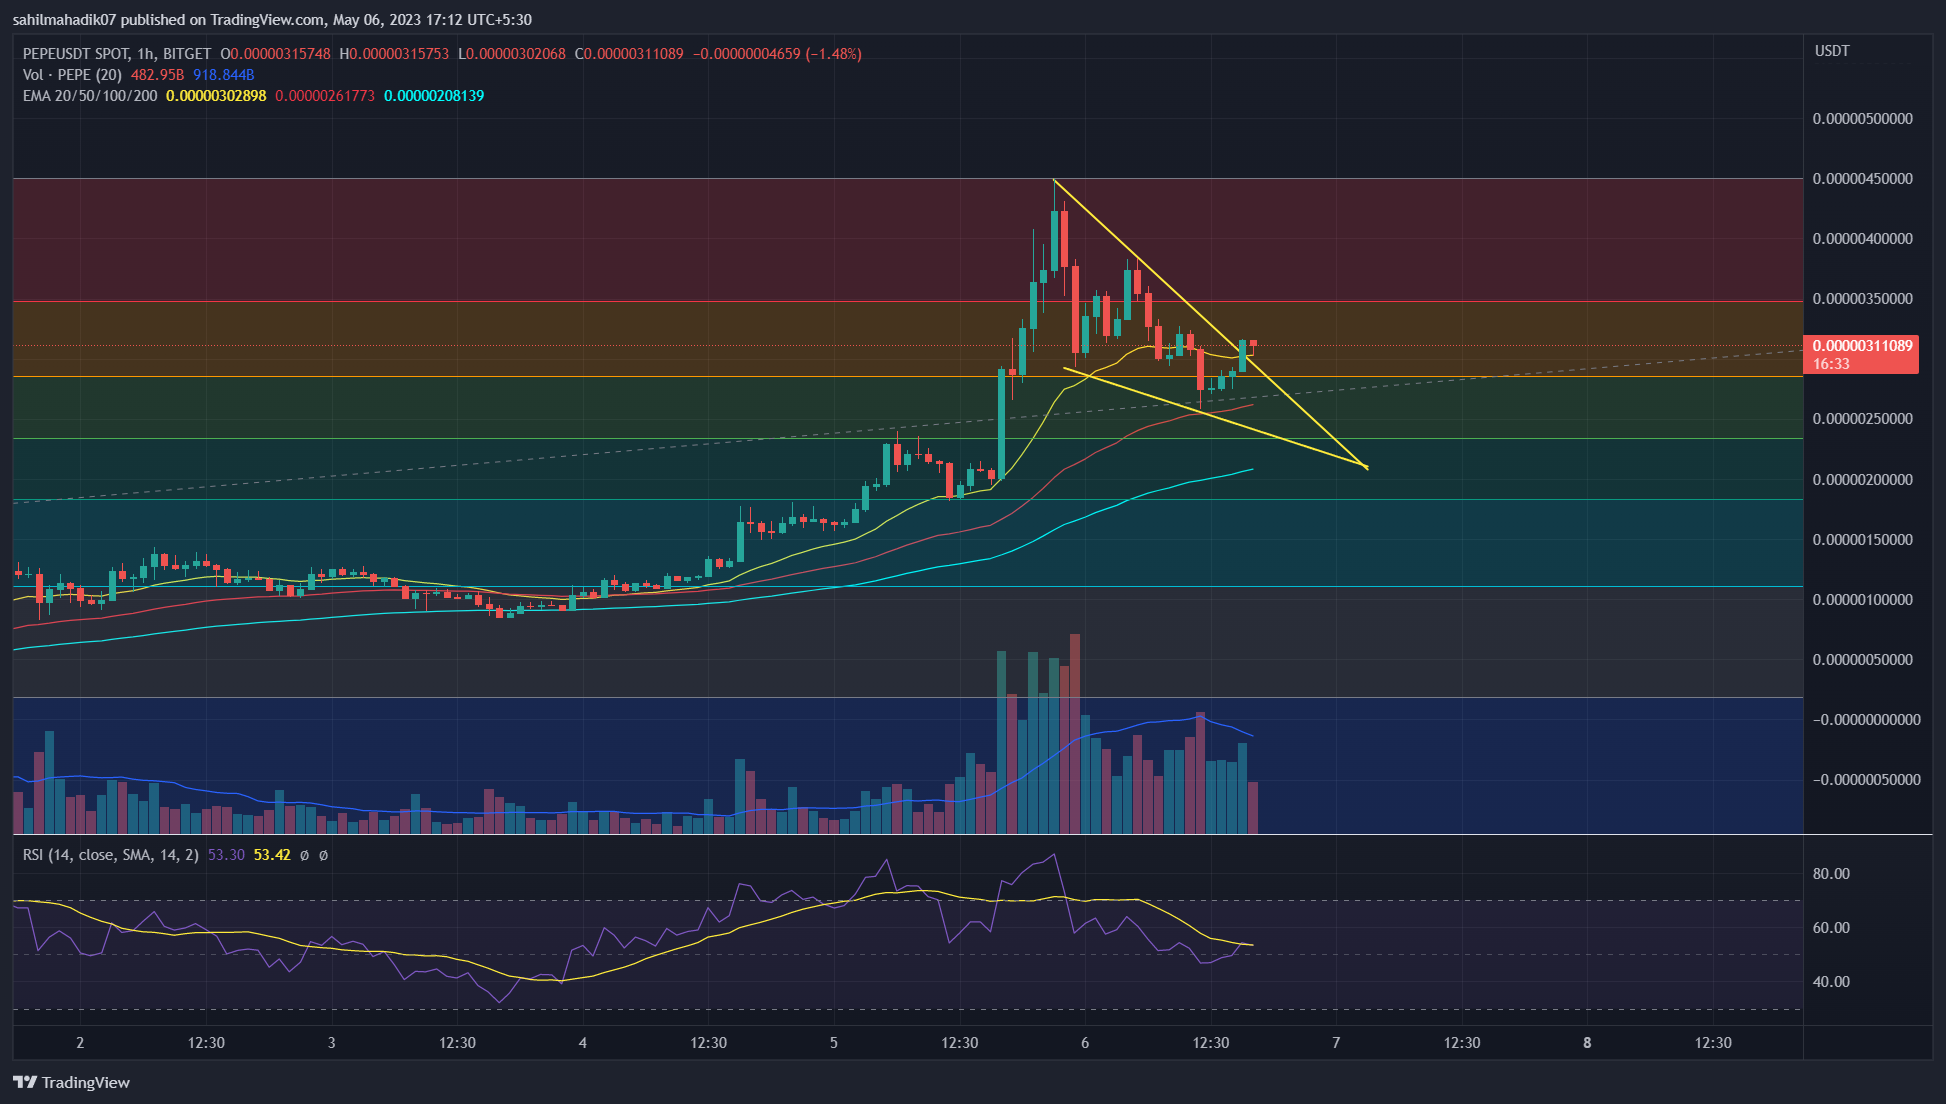
Bullish Pattern in the Hourly Chart Offers an Entry Opportunity
Source- Tradingview
The pepe coin shows the formation of a flag pattern in the hourly time frame chart. A slight upswing in price gave a bullish breakout from the pattern’s resistance trendline, indicating a higher possibility of upcoming recovery.
If the coin price shows sustainability above the breached trendline, the pepecoin could be 45% higher to rechallenge the ATH ceiling.
On a contrary note, if the coin price breaks below the trendline this bullish thesis will get invalidated.
Technical Indicator
Exponential Moving Average: In the hourly chart, the 20-day EMA acts as excellent dynamic support to assist buyers during occasion pullbacks.
Relative Strength Index: The hourly RSI slope above the midline(50%) indicates the market sentiment remains positive.
PEPE Intraday Price Levels
- Spot price: $0.00000306
- Trend: bearish
- Volatility: Medium
- Resistance level- $0.0000038 and $0.0000045
- Support level- $0.0000027 and $0.0000023
Share this article on:
advertisement
The presented content may include the personal opinion of the author and is subject to market condition. Do your market research before investing in cryptocurrencies. The author or the publication does not hold any responsibility for your personal financial loss.
<!– Close Story–>
- SEO Powered Content & PR Distribution. Get Amplified Today.
- PlatoAiStream. Web3 Data Intelligence. Knowledge Amplified. Access Here.
- Minting the Future w Adryenn Ashley. Access Here.
- Buy and Sell Shares in PRE-IPO Companies with PREIPO®. Access Here.
- Source: https://coingape.com/markets/pepe-price-prediction-healthy-retracement-prepare-pepecoin-for-further-rally/

