SNEAK PEEK
- Bearish takes control of the PEPE market after a week of consolidation.
- The bears have pushed the price down to $0.000001526.
- Trading volume is on the decline as bulls struggle to push prices higher.
Pepe price analysis shows a bearish trend in today’s market. The daily chart shows a downward movement to $0.000001526, representing a 2.75 percent drop from last today’s high of $0.000001632. The selling pressure behind the movements is strong and has been increasing since last week. However, the PEPE market opened today, trading in bullish territory the downtrend has quickly taken over.
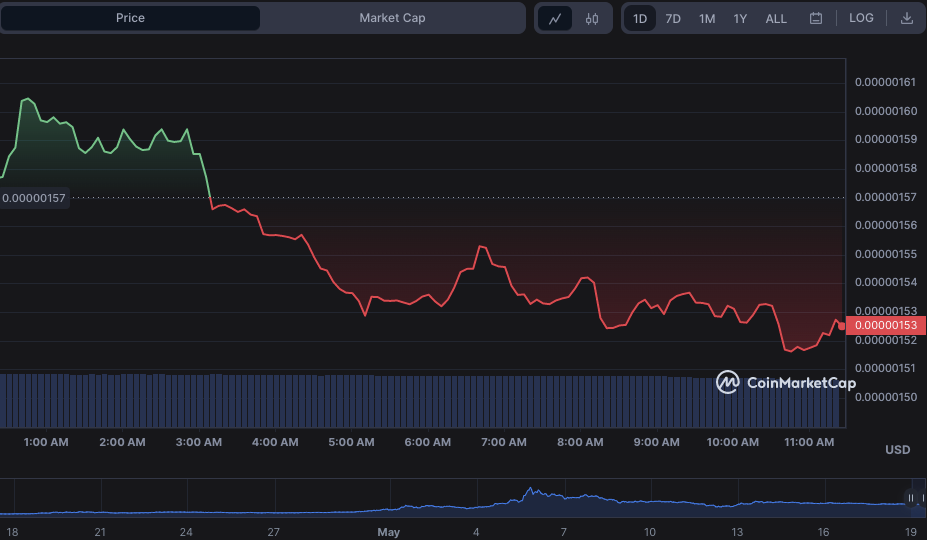
At this point, the bears have taken control of the market and are dominating trading activity. The support level for the PEPE market is currently at $0.000001514, and the resistance level is set at $0.000001632. A break below this level could signal further downside potential in the near future, while a break above this level could see the start of a reversal.
Trading volume has been on the decline since yesterday, with only 240 million PEPE tokens exchanged in the past 24 hours. This shows that buyers are struggling to gain control of the market as prices remain rangebound. The market capitalization of the PEPE coin also stands at $597 million, representing a slight drop from yesterday’s by 3.02 percent. The circulating supply of the PEPE token is also coming down, now standing at 391,790,000,000,000 PEPE.
The holders of Pepecoin (PEPE) might be selling their positions to make profits after experiencing an astronomical increase of almost 5,000,000% in the value of the altcoin over the last few weeks. This drop in price could have been worsened by traders who were either making profits in their positions or using advanced trading methods. These actions followed the introduction of several pepe-tracked futures during the past week.
Looking at the hourly technical indicators, the EMA20 is sitting below the EMA50, indicating a bearish trend in the short term. The MACD shows strong bearish momentum as both lines are trending downwards and have crossed over into negative territory. The Moving average indicator on the 4-hour chart is present at $0.000001563, indicating a bearish trend in the mid-term.
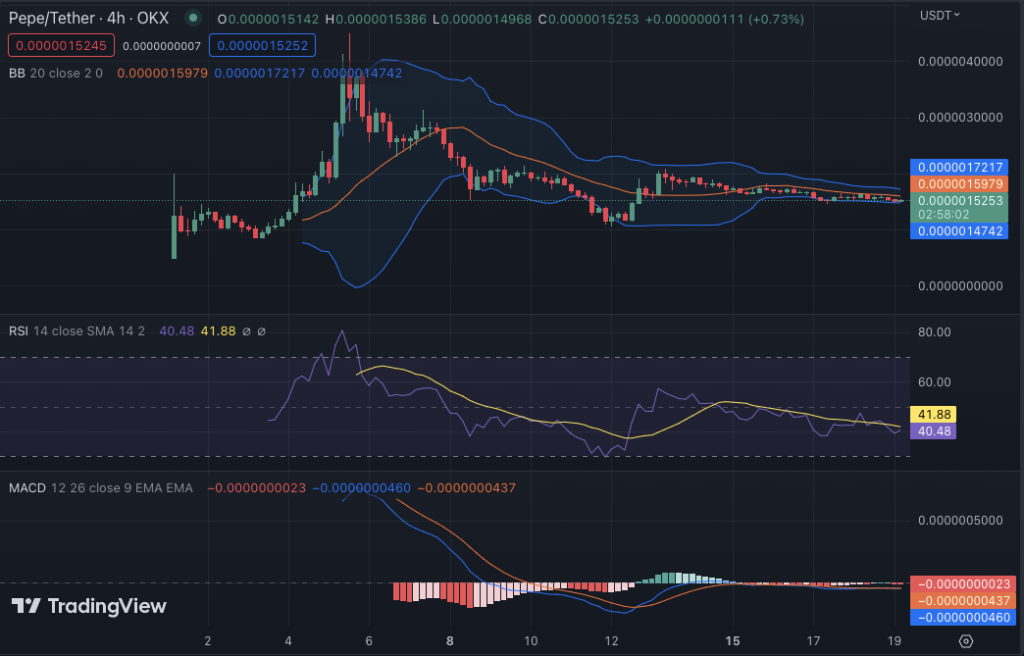
The Bollinger Bands are contracting which suggests that the volatility is reducing. The upper Bollinger Band is currently at $0.000001721, which may act as a strong resistance level in the coming hours, while the lower band is present at $0.000001474, which could act as a support level in the coming hours. The RSI indicator is at a bearish level of 40.48, again showing that the selling pressure remains strong in the PEPE market.
In conclusion, bears have gained control over the PEPE market as investors become increasingly cautious. Bulls will need to step up their activity for prices to reverse the current bearish trend. The support and resistance levels should be watched closely to keep an eye on any potential price reversals in the near future. The technical indicators also remain bearish, suggesting further declines are possible in the coming hours.
Disclaimer: Cryptocurrency price is highly speculative and volatile and should not be considered financial advice. Past and current performance is not indicative of future results. Always research and consult with a financial advisor before making investment decisions.
- SEO Powered Content & PR Distribution. Get Amplified Today.
- PlatoAiStream. Web3 Data Intelligence. Knowledge Amplified. Access Here.
- Minting the Future w Adryenn Ashley. Access Here.
- Buy and Sell Shares in PRE-IPO Companies with PREIPO®. Access Here.
- Source: https://investorbites.com/pepe-price-analysis-19-05/

