- Bullish breakout seen in US Treasury 10-year yield above 3.90%, next resistance at 4.46%.
- Long-duration assets (fixed income & growth stocks) sold off and underperformed in the past two days.
- Record low level of implied correlation among S&P 500 stocks may lead to a spike in VIX.
- Asian stocks underperformed reinforced by a weak yuan despite subtle interventions by PBoC.
Déjà vu, it’s all about government bond yields again
In the past two days, we have seen several significant movements in the global financial markets. First, let’s start with the sovereign bond yields, which are considered the all-important “risk-free” interest rates to be used as a benchmark to price a wide myriad of financial instruments from plain-vanilla corporate, consumer loans to exotic structured products that involve derivatives. Hence, any big moves in these “risk-free” interest rates will have a huge ripple effect and may trigger abrupt vibration across cross-assets.
Since the start of June 2023, sovereign bond yields across the curve (different maturities) have started to revert to their respective medium-term uptrend phases with the shorter-dated yields rising a higher magnitude over their long-term dated peers reinforced by “higher interest rates for longer-periods” monetary policies guidance advocated major developed central banks with the exception in Japan and China.
Long-dated sovereign yields increased at a faster rate than shorter-dated yields
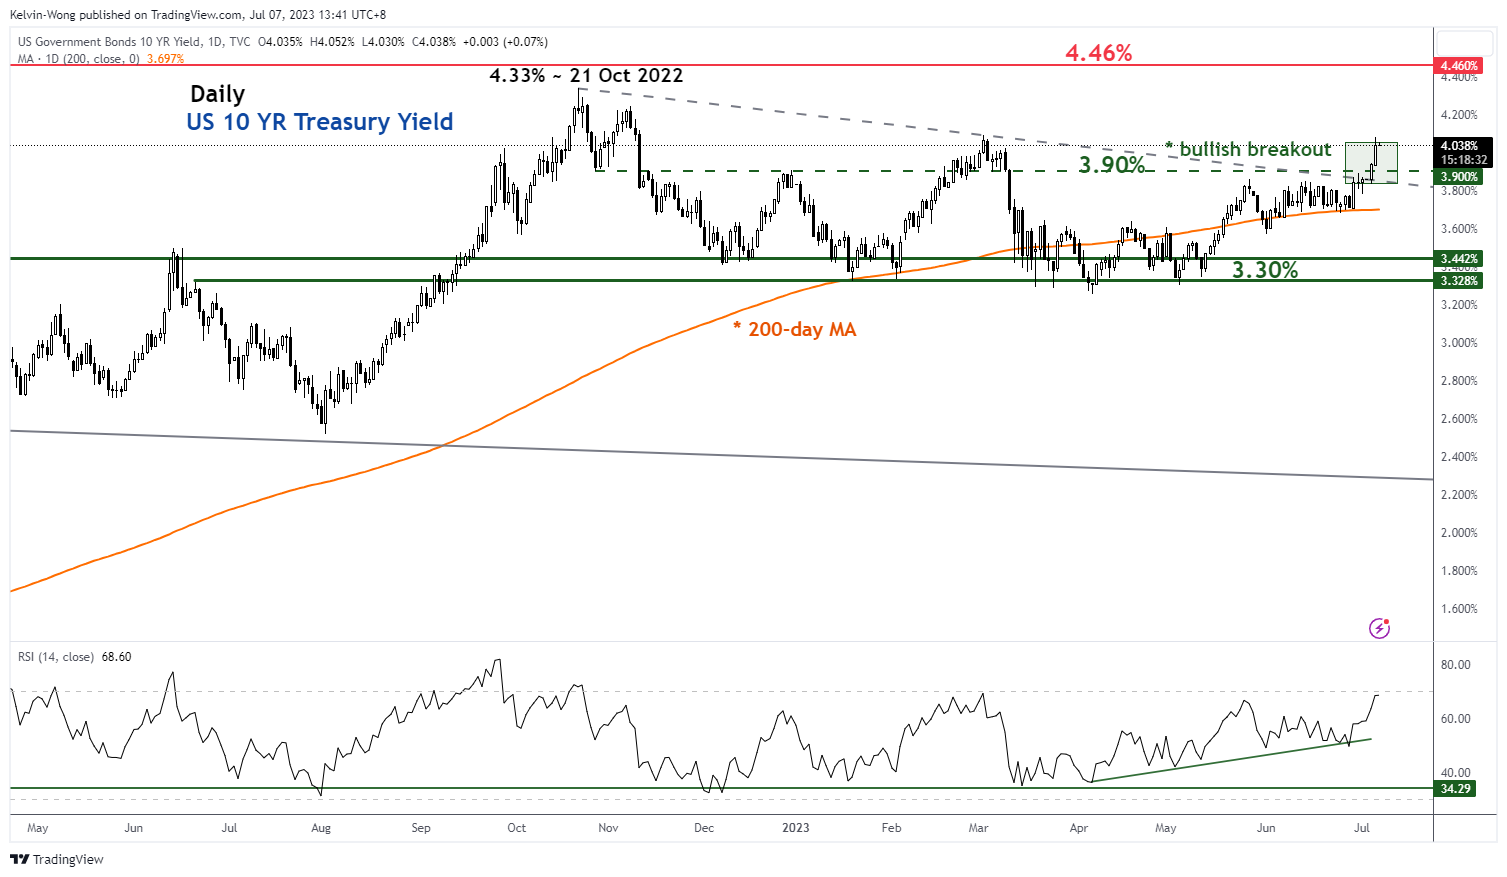
Fig 1: US Treasury 10-year yield medium-term trend as of 7 Jul 2023 (Source: TradingView, click to enlarge chart)
Interestingly in the past two days, the pendulum has shifted where the momentum of the longer-dated yields rose at a faster pace; the US Treasury 10-year yield rallied by 18 basis points (bps) versus the 2-year yield with a gain of 8 bps. It is likely to be triggered by flows and technical factors where the US Treasury 10-year yield has finally managed to clear a key intermediate resistance level of 3.90% on Wednesday, 5 July which has capped its prior price actions within a range-bound environment since 21 October 2022.
Duration risk and implied volatilities increase
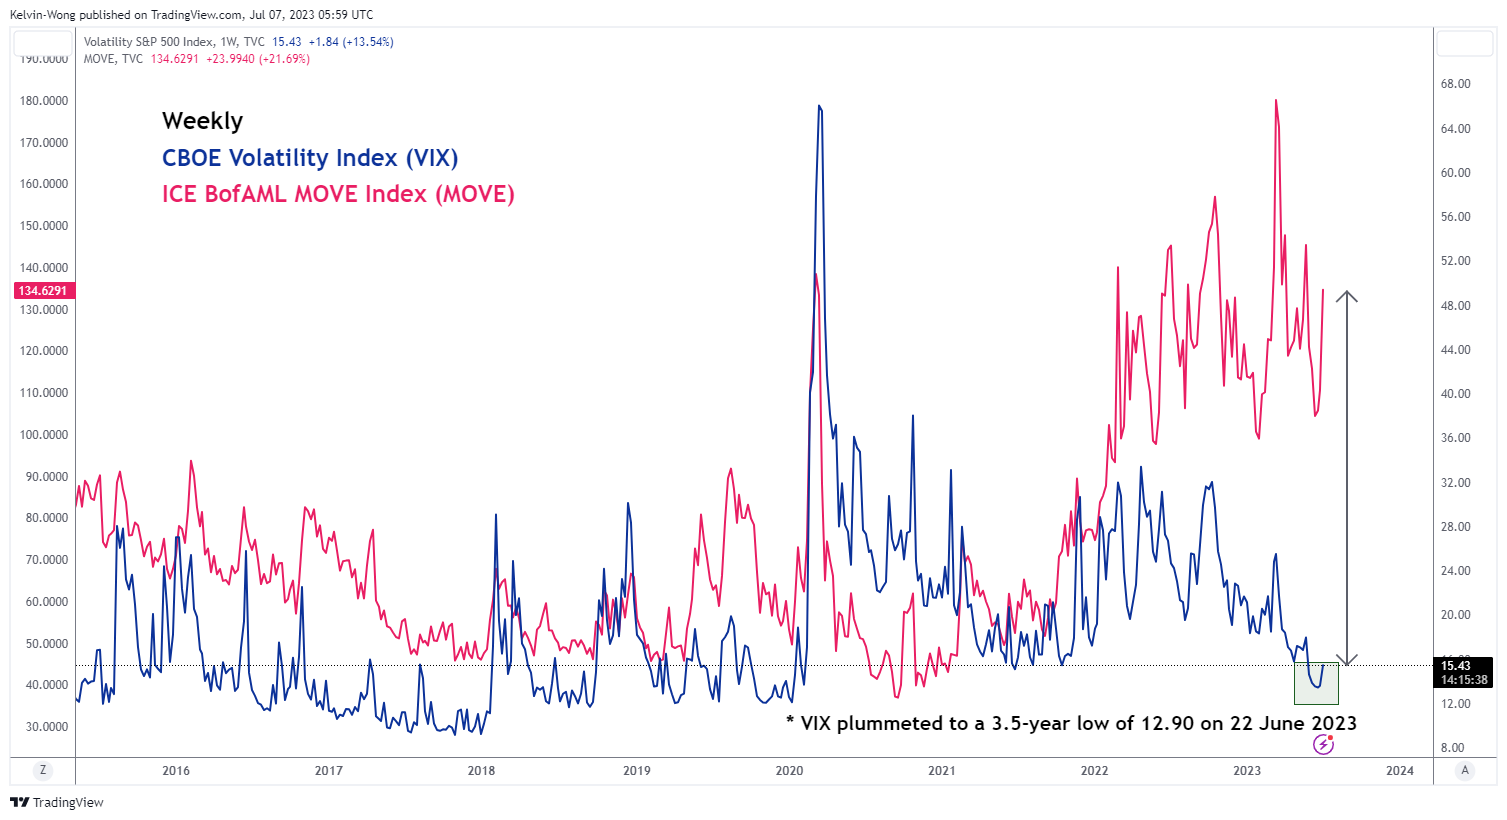
Fig 2: CBOE VIX & ICE BofAML MOVE as of 6 Jul 2023 (Source: TradingView, click to enlarge chart)
Duration risk embedded in long-duration financial assets has increased due to changes in the potential repricing behaviour of market participants. Longer-dated bonds sold off and long-duration growth equities that tend not to have stable or negligible dividend payouts underperformed.
The iShares US 20+ year Treasury Bond exchange-traded fund dropped by -2.33% in the past two days to its lowest level last seen in late December 2022. Over the same period in the equities space, the Russell 2000 consists of small-caps declined by 2.88% and semiconductors, a key emerging technology sector theme play that rallied by 45% in the first six months of this year fuelled by the optimism in artificial intelligence’s future productivity gains for the economy shed -3.44% seen in the iShares PHLX Semiconductor exchange-traded fund.
The ICE BofAML MOVE Index which tracks the aggregate US Treasuries’ yield implied volatility across different maturities via options has jumped by 35% from Monday, 3 July to a level not seen early March this year before the flared up of US regional banks turmoil. Hence, US banking stocks also took a severe beating in the last two trading sessions where the SPDR S&P Bank and Regional Banking exchange-traded funds declined by -2.89% and -2.92% respectively due to heightened fears of duration risk mismatch in their balance sheets.
In general, equities’ implied volatility inferred from the CBOE VIX index has started to tick up as well but at a lower magnitude, it has jumped up to 15.43 from a 3.5-year low of 12.90 printed on 22 June 2023.
Low correlation among S&P 500 constituents may lead to a further spike in VIX
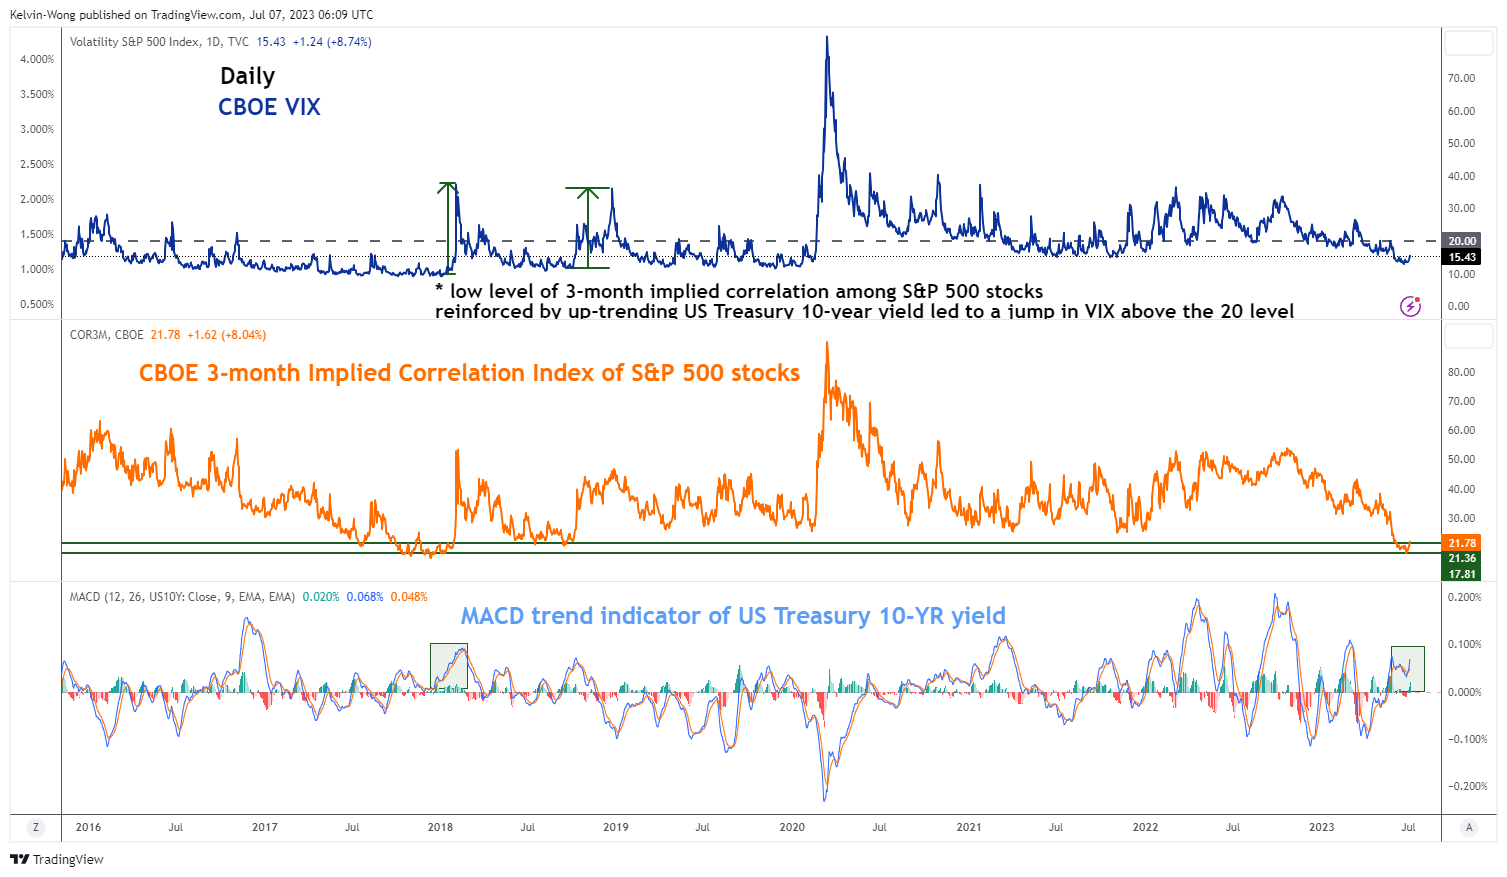
Fig 3: CBOE VIX, implied correlation index of S&P 500 stocks & MACD trend indicator of UST 10-year yield as of 6 Jul 2023
(Source: TradingView, click to enlarge chart)
An interesting point to note is that the prior low level of VIX has coincided with market participants’ perceptions of future low correlation readings of the US S&P 500 index constituents reinforced by a significant portion (more than 80%) of the gains of the S&P 500’s first 6-month return of +15.91% has been contributed by just a handful of mega-cap technology stocks and Tesla.
The CBOE 3-month Implied Correlation Index that measures the 3-month expected correlation across the top 50 value-weighted S&P 500 constituents has dipped close to a 5.5-year low of 17.81 on Wednesday, 5 July which suggests a potential high degree of calm and complacency among market participants.
Based on past data, such low compressed levels of 3-month expected correlation across the top 50 value-weighted S&P 500 constituents and the VIX can set up a significant increase in equities’ volatility triggered by a macro systemic negative shock.
For example, during the period from January to February 2018, the VIX jumped above the 20 level with the MACD trend indicator of the US Treasury 10-year yield that exhibited an uptrend condition, and such a similar condition has been depicted recently at the start of June 2023.
Double whammy for Asian stocks
Since the start of this week, Asian benchmark indices have underperformed the US. The MSCI All Country Asia ex Japan has declined by 1.49% with Japan’s Nikkei 225 loss of -2.17%, surpassing the US S&P 500 (-0.87%) dragged down by China proxies and a weak yuan. The Hang Seng indices were the worst performer so far In Asia; the Hang Seng Index (-2.40%) and Hang Seng China Enterprises Index (-2.67%) intra-week performances at this time of the writing.
Despite various subtle interventions conducted this week by China’s central bank, PBoC where it directed the major state banks to cut their US dollar deposits rates for the second time in a month to 2.8% from 4.3% previously as well as published a commentary in a state-backed media that China has ample tools to stabilize the foreign exchange market even if the yuan suffers a bout of panic selling, the USD/CNH (offshore yuan) just dipped slightly lower by -0.11% to 7.2465 from last week’s closing level of 7.2675.
The current weakness seen in the yuan is being supported by the widening of the positive yield spread of US Treasuries over China sovereign bonds, further reinforced by the past two days of rallies seen in the US Treasuries yields. All these movements trigger a negative feedback loop back into Asian stocks.
Content is for general information purposes only. It is not investment advice or a solution to buy or sell securities. Opinions are the authors; not necessarily that of OANDA Business Information & Services, Inc. or any of its affiliates, subsidiaries, officers or directors. If you would like to reproduce or redistribute any of the content found on MarketPulse, an award winning forex, commodities and global indices analysis and news site service produced by OANDA Business Information & Services, Inc., please access the RSS feed or contact us at [email protected]. Visit https://www.marketpulse.com/ to find out more about the beat of the global markets. © 2023 OANDA Business Information & Services Inc.
Latest posts by Kelvin Wong (see all)
- SEO Powered Content & PR Distribution. Get Amplified Today.
- PlatoData.Network Vertical Generative Ai. Empower Yourself. Access Here.
- PlatoAiStream. Web3 Intelligence. Knowledge Amplified. Access Here.
- PlatoESG. Automotive / EVs, Carbon, CleanTech, Energy, Environment, Solar, Waste Management. Access Here.
- BlockOffsets. Modernizing Environmental Offset Ownership. Access Here.
- Source: https://www.marketpulse.com/indices/no-summer-lull-for-global-equities/kwong

