This post is co-written with Travis Bronson, and Brian L Wilkerson from Duke Energy
Machine learning (ML) is transforming every industry, process, and business, but the path to success is not always straightforward. In this blog post, we demonstrate how Duke Energy, a Fortune 150 company headquartered in Charlotte, NC., collaborated with the AWS Machine Learning Solutions Lab (MLSL) to use computer vision to automate the inspection of wooden utility poles and help prevent power outages, property damage and even injuries.
The electric grid is made up of poles, lines and power plants to generate and deliver electricity to millions of homes and businesses. These utility poles are critical infrastructure components and subject to various environmental factors such as wind, rain and snow, which can cause wear and tear on assets. It’s critical that utility poles are regularly inspected and maintained to prevent failures that can lead to power outages, property damage and even injuries. Most power utility companies, including Duke Energy, use manual visual inspection of utility poles to identifyanomalies related to their transmission and distribution network. But this method can be costlyand time-consuming, and it requires that power transmission lineworkers follow rigorous safety protocols.
Duke Energy has used artificial intelligence in the past to create efficiencies in day-to-day operations to great success. The company has used AI to inspect generation assets and critical infrastructure and has been exploring opportunities to apply AI to the inspection of utility poles as well. Over the course of the AWS Machine Learning Solutions Lab engagement with Duke Energy, the utility progressed its work to automate the detection of anomalies in wood poles using advanced computer vision techniques.
Goals and use case
The goal of this engagement between Duke Energy and the Machine Learning Solutions Lab is to leverage machine learning to inspect hundreds of thousands of high-resolution aerial images to automate the identification and review process of all wood pole-related issues across 33,000 miles of transmission lines. This goal will further help Duke Energy to improve grid resiliency and comply with government regulations by identifying the defects in a timely manner. It will also reduce fuel and labor costs, as well as reduce carbon emissions by minimizing unnecessary truck rolls. Finally, it will also improve safety by minimizing miles driven, poles climbed and physical inspection risks associated with compromising terrain and weather conditions.
In the following sections, we present the key challenges associated with developing robust and efficient models for anomaly detection related to wood utility poles. We also describe the key challenges and suppositions associated with various data preprocessing techniques employed to achieve the desired model performance. Next, we present the key metrics used for evaluating the model performance along with the evaluation of our final models. And finally, we compare various state-of-the-art supervised and unsupervised modeling techniques.
Challenges
One of the key challenges associated with training a model for detecting anomalies using aerial images is the non-uniform image sizes. The following figure shows the distribution of image height and width of a sample data set from Duke Energy. It can be observed that the images have a large amount of variation in terms of size. Similarly, the size of images also pose significant challenges. The size of input images are thousands of pixels wide and thousands of pixels long. This is also not ideal for training a model for identification of the small anomalous regions in the image.
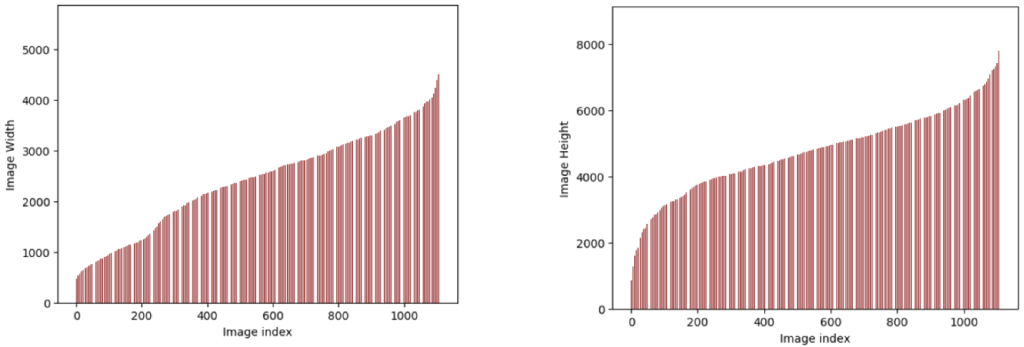
Distribution of image height and width for a sample data set
Also, the input images contain a large amount of irrelevant background information such as vegetation, cars, farm animals, etc. The background information could result in suboptimal model performance. Based on our assessment, only 5% of the image contains the wood poles and the anomalies are even smaller. This a major challenge for identifying and localizing anomalies in the high-resolution images. The number of anomalies is significantly smaller, compared to the entire data set. There are only 0.12% of anomalous images in the entire data set (i.e., 1.2 anomalies out of 1000 images). Finally, there is no labeled data available for training a supervised machine learning model. Next, we describe how we address these challenges and explain our proposed method.
Solution overview
Modeling techniques
The following figure demonstrates our image processing and anomaly detection pipeline. We first imported the data into Amazon Simple Storage Service (Amazon S3) using Amazon SageMaker Studio. We further employed various data processing techniques to address some of the challenges highlighted above to improve the model performance. After data preprocessing, we employed Amazon Rekognition Custom Labels for data labeling. The labeled data is further used to train supervised ML models such as Vision Transformer, Amazon Lookout for Vision, and AutoGloun for anomaly detection.
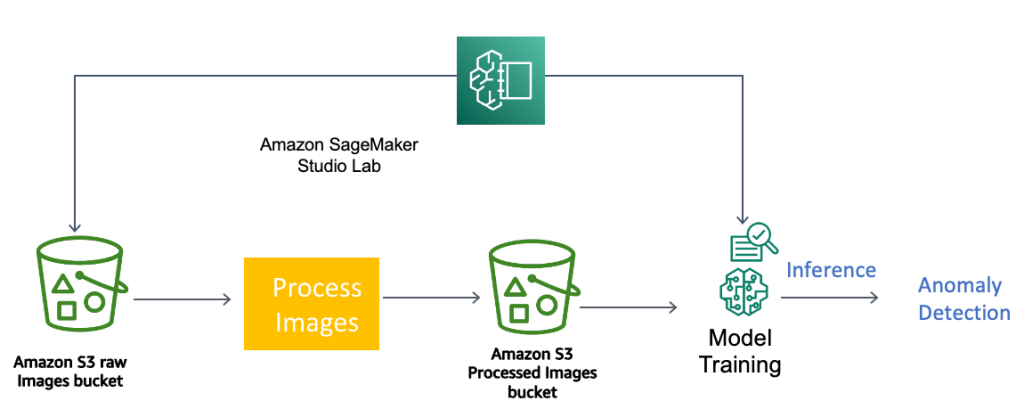
Image processing and anomaly detection pipeline
The following figure demonstrates the detailed overview of our proposed approach that includes the data processing pipeline and various ML algorithms employed for anomaly detection. First, we will describe the steps involved in the data processing pipeline. Next, we will explain the details and intuition related to various modeling techniques employed during this engagement to achieve the desired performance goals.

Data preprocessing
The proposed data preprocessing pipeline includes data standardization, identification of region of interest (ROI), data augmentation, data segmentation, and finally data labeling. The purpose of each step is described below:
Data standardization
The first step in our data processing pipeline includes data standardization. In this step, each image is cropped and divided into non overlapping patches of size 224 X 224 pixels. The goal of this step is to generate patches of uniform sizes that could be further utilized for training a ML model and localizing the anomalies in high resolution images.
Identification of region of interest (ROI)
The input data consists of high-resolution images containing large amount of irrelevant background information (i.e., vegetation, houses, cars, horses, cows, etc.). Our goal is to identify anomalies related to wood poles. In order to identify the ROI (i.e., patches containing the wood pole), we employed Amazon Rekognition custom labeling. We trained an Amazon Rekognition custom label model using 3k labeled images containing both ROI and background images. The goal of the model is to do a binary classification between the ROI and background images. The patches identified as background information are discarded while the crops predicted as ROI are used in the next step. The following figure demonstrates the pipeline that identifies the ROI. We generated a sample of non-overlapping crops of 1,110 wooden images that generated 244,673 crops. We further used these images as input to an Amazon Rekognition custom model that identified 11,356 crops as ROI. Finally, we manually verified each of these 11,356 patches. During the manual inspection, we identified the model was able to correctly predict 10,969 wood patches out of 11,356 as ROI. In other words, the model achieved 96% precision.
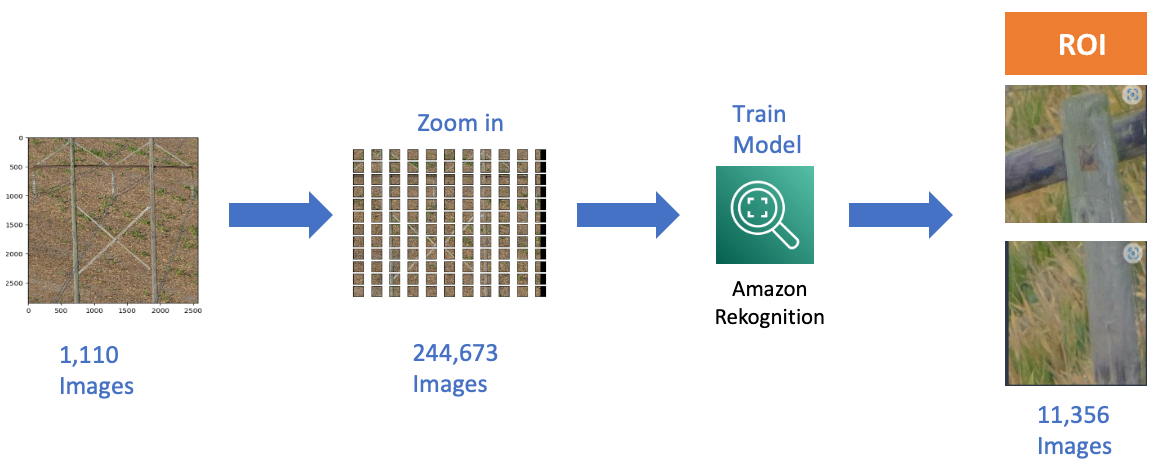
Identification of region of interest
Data labeling
During the manual inspection of the images, we also labeled each image with their associated labels. The associated labels of images include wood patch, non-wood patch, non-structure, non-wood patch and finally wood patches with anomalies. The following figure demonstrates the nomenclature of the images using Amazon Rekognition custom labeling.

Data augmentation
Given the limited amount of labeled data that was available for training, we augmented the training data set by making horizontal flips of all of the patches. This had the effective impact of doubling the size of our data set.
Segmentation
We labeled the objects in 600 images (poles, wires, and metal railing) using the bounding box object detection labeling tool in Amazon Rekognition Custom Labels and trained a model to detect the three main objects of interest. We used the trained model to remove the background from all the images, by identifying and extracting the poles in each image, while removing the all other objects as well as the background. The resulting dataset had fewer images than the original data set, as a result of removing all images that don’t contain wood poles. In addition, there was also a false positive image that were removed from the dataset.
Anomaly detection
Next, we use the preprocessed data for training the machine learning model for anomaly detection. We employed three different methods for anomaly detection which includes AWS Managed Machine Learning Services (Amazon Lookout for Vision [L4V], Amazon Rekognition), AutoGluon, and Vision Transformer based self-distillation method.
AWS Services
Amazon Lookout for Vision (L4V)
Amazon Lookout for Vision is a managed AWS service that enables swift training and deployment of ML models and provides anomaly detection capabilities. It requires fully labelled data, which we provided by pointing to the image paths in Amazon S3. Training the model is as a simple as a single API (Application programming interface) call or console button click and L4V takes care of model selection and hyperparameter tuning under the hood.
Amazon Rekognition
Amazon Rekognition is a managed AI/ML service similar to L4V, which hides modelling details and provides many capabilities such as image classification, object detection, custom labelling, and more. It provides the ability to use the built-in models to apply to previously known entities in images (e.g., from ImageNet or other large open datasets). However, we used Amazon Rekognition’s Custom Labels functionality to train the ROI detector, as well as an anomaly detector on the specific images that Duke Energy has. We also used the Amazon Rekognition’s Custom Labels to train a model to put bounding boxes around wood poles in each image.
AutoGloun
AutoGluon is an open-source machine learning technique developed by Amazon. AutoGluon includes a multi-modal component which allows easy training on image data. We used AutoGluon Multi-modal to train models on the labelled image patches to establish a baseline for identifying anomalies.
Vision Transformer
Many of the most exciting new AI breakthroughs have come from two recent innovations: self-supervised learning, which allows machines to learn from random, unlabeled examples; and Transformers, which enable AI models to selectively focus on certain parts of their input and thus reason more effectively. Both methods have been a sustained focus for the Machine learning community, and we’re pleased to share that we used them in this engagement.
In particular, working in collaboration with researchers at Duke Energy, we used pre-trained self-distillation ViT (Vision Transformer) models as feature extractors for the downstream anomaly detection application using Amazon Sagemaker. The pre-trained self-distillation vision transformer models are trained on large amount of training data stored on Amazon S3 in a self-supervised manner using Amazon SageMaker. We leverage the transfer learning capabilities of ViT models pre-trained on large scale datasets (e.g., ImageNet). This helped us achieve a recall of 83% on an evaluation set using only a few thousands of labeled images for training.
Evaluation metrics
The following figure shows the key metrics used to evaluate model performance and its impacts. The key goal of the model is to maximize anomaly detection (i.e. true positives) and minimize the number of false negatives, or times when the anomalies that could lead to outages are beingmisclassified.
Once the anomalies are identified, technicians can address them, preventing future outages and ensuring compliance with government regulations. There’s another benefit to minimizing false positives: you avoid the unnecessary effort of going through images again.

Keeping these metrics in mind, we track the model performance in terms of following metrics, which encapsulates all four metrics defined above.
Precision
The percent of anomalies detected that are actual anomalies for objects of interest. Precision measures how well our algorithm identifies only anomalies. For this use case, high precision means low false alarms (i.e., the algorithm falsely identifies a woodpecker hole while there isn’t any in the image).
![]()
Recall
The percent of all anomalies that are recovered for each object of interest. Recall measures how well we identify all anomalies. This set captures some percentage of the full set of anomalies, and that percentage is the recall. For this use case, high recall means that we’re good at catching woodpecker holes when they occur. Recall is therefore the right metric to focus on in this POC because false alarms are at best annoying while missed anomalies could lead to serious consequence if left unattended.
![]()
Lower recall can lead to outages and government regulation violations. While lower precision leads to wasted human effort. The primary goal of this engagement is to identify all the anomalies to comply with government regulation and avoid any outage, hence we prioritize improving recall over precision.
Evaluation and model comparison
In the following section, we demonstrate the comparison of various modeling techniques employed during this engagement. We evaluated the performance of two AWS services Amazon Rekognition and Amazon Lookout for Vision. We also evaluated various modeling techniques using AutoGluon. Finally, we compare the performance with state-of-the-art ViT based self-distillation method.
The following figure shows the model improvement for the AutoGluon using different data processing techniques over the period of this engagement. The key observation is as we improve the data quality and quantity the performance of the model in terms of recall improved from below 30% to 78%.
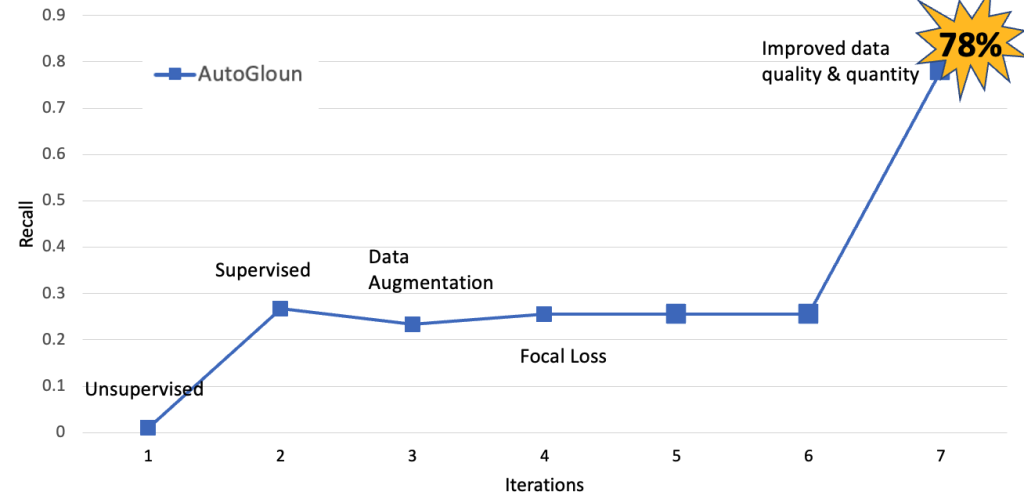
Next, we compare the performance of AutoGluon with AWS services. We also employed various data processing techniques that helped improve the performance. However, the major improvement came from increasing the data quantity and quality. We increase the dataset size from 11 K images in total to 60 K images.

Next, we compare the performance of AutoGluon and AWS services with ViT based method. The following figure demonstrates that ViT-based method, AutoGluon and AWS services performed on par in terms of recall. One key observation is, beyond a certain point, increase in data quality and quantity does not help increase the performance in terms of recall. However, we observe improvements in terms of precision.

Precision versus recall comparison
| Amazon AutoGluon | Predicted anomalies | Predicted normal |
| Anomalies | 15600 | 4400 |
| Normal | 3659 | 38341 |
Next, we present the confusion matrix for AutoGluon and Amazon Rekognition and ViT based method using our dataset that contains 62 K samples. Out of 62K samples, 20 K samples are anomalous while remaining 42 K images are normal. It can be observed that ViT based methods captures largest number of anomalies (16,600) followed by Amazon Rekognition (16,000) and Amazon AutoGluon (15600). Similarly, Amazon AutoGluon has least number of false positives (3659 images) followed by Amazon Rekognition (5918) and ViT (15323). These results demonstrates that Amazon Rekognition achieves the highest AUC (area under the curve).
| Amazon Rekognition | Predicted anomalies | Predicted normal |
| Anomalies | 16,000 | 4000 |
| Normal | 5918 | 36082 |
| ViT | Predicted anomalies | Predicted normal |
| Anomalies | 16,600 | 3400 |
| Normal | 15,323 | 26,677 |
Conclusion
In this post, we showed you how the MLSL and Duke Energy teams worked together to develop a computer vision-based solution to automate anomaly detection in wood poles using high resolution images collected via helicopter flights. The proposed solution employed a data processing pipeline to crop the high-resolution image for size standardization. The cropped images are further processed using Amazon Rekognition Custom Labels to identify the region of interest (i.e., crops containing the patches with poles). Amazon Rekognition achieved 96% precision in terms of correctly identifying the patches with poles. The ROI crops are further used for anomaly detection using ViT based self-distillation mdoel AutoGluon and AWS services for anomaly detection. We used a standard data set to evaluate the performance of all three methods. The ViT based model achieved 83% recall and 52% precision. AutoGluon achieved 78% recall and 81% precision. Finally, Amazon Rekognition achieves 80% recall and 73% precision. The goal of using three different methods is to compare the performance of each method with different number of training samples, training time, and deployment time. All these methods take less than 2 hours to train a and deploy using a single A100 GPU instance or managed services on Amazon AWS. Next, steps for further improvement in model performance include adding more training data for improving model precision.
Overall, the end-to-end pipeline proposed in this post help achieve significant improvements in anomaly detection while minimizing operations cost, safety incident, regulatory risks, carbon emissions, and potential power outages.
The solution developed can be employed for other anomaly detection and asset health-related use cases across transmission and distribution networks, including defects in insulators and other equipment. For further assistance in developing and customizing this solution, please feel free to get in touch with the MLSL team.
About the Authors
 Travis Bronson is a Lead Artificial Intelligence Specialist with 15 years of experience in technology and 8 years specifically dedicated to artificial intelligence. Over his 5-year tenure at Duke Energy, Travis has advanced the application of AI for digital transformation by bringing unique insights and creative thought leadership to his company’s leading edge. Travis currently leads the AI Core Team, a community of AI practitioners, enthusiasts, and business partners focused on advancing AI outcomes and governance. Travis gained and refined his skills in multiple technological fields, starting in the US Navy and US Government, then transitioning to the private sector after more than a decade of service.
 Brian Wilkerson is an accomplished professional with two decades of experience at Duke Energy. With a degree in computer science, he has spent the past 7 years excelling in the field of Artificial Intelligence. Brian is a co-founder of Duke Energy’s MADlab (Machine Learning, AI and Deep learning team). Hecurrently holds the position of Director of Artificial Intelligence & Transformation at Duke Energy, where he is passionate about delivering business value through the implementation of AI.
 Ahsan Ali is an Applied Scientist at the Amazon Generative AI Innovation Center, where he works with customers from different domains to solve their urgent and expensive problems using Generative AI.
 Tahin Syed is an Applied Scientist with the Amazon Generative AI Innovation Center, where he works with customers to help realize business outcomes with generative AI solutions. Outside of work, he enjoys trying new food, traveling, and teaching taekwondo.
 Dr. Nkechinyere N. Agu is an Applied Scientist in the Generative AI Innovation Center at AWS. Her expertise is in Computer Vision AI/ML methods, Applications of AI/ML to healthcare, as well as the integration of semantic technologies (Knowledge Graphs) in ML solutions. She has a Masters and a Doctorate in Computer Science.
 Aldo Arizmendi is a Generative AI Strategist in the AWS Generative AI Innovation Center based out of Austin, Texas. Having received his B.S. in Computer Engineering from the University of Nebraska-Lincoln, over the last 12 years, Mr. Arizmendi has helped hundreds of Fortune 500 companies and start-ups transform their business using advanced analytics, machine learning, and generative AI.
 Stacey Jenks is a Principal Analytics Sales Specialist at AWS, with more than two decades of experience in Analytics and AI/ML. Stacey is passionate about diving deep on customer initiatives and driving transformational, measurable business outcomes with data. She is especially enthusiastic about the mark that utilities will make on society, via their path to a greener planet with affordable, reliable, clean energy.
 Mehdi Noor is an Applied Science Manager at Generative Ai Innovation Center. With a passion for bridging technology and innovation, he assists AWS customers in unlocking the potential of Generative AI, turning potential challenges into opportunities for rapid experimentation and innovation by focusing on scalable, measurable, and impactful uses of advanced AI technologies, and streamlining the path to production.
- SEO Powered Content & PR Distribution. Get Amplified Today.
- PlatoData.Network Vertical Generative Ai. Empower Yourself. Access Here.
- PlatoAiStream. Web3 Intelligence. Knowledge Amplified. Access Here.
- PlatoESG. Automotive / EVs, Carbon, CleanTech, Energy, Environment, Solar, Waste Management. Access Here.
- PlatoHealth. Biotech and Clinical Trials Intelligence. Access Here.
- ChartPrime. Elevate your Trading Game with ChartPrime. Access Here.
- BlockOffsets. Modernizing Environmental Offset Ownership. Access Here.
- Source: https://aws.amazon.com/blogs/machine-learning/improving-asset-health-and-grid-resilience-using-machine-learning/

