Dogecoin, the popular meme coin, is making waves once again. A recent tweet by renowned analyst Ali Martinez has made waves in the crypto community, hinting at the potential for a significant rally for DOGE.
In a Twitter post that quickly gained traction, Martinez highlighted an intriguing pattern on the monthly chart of Dogecoin. According to the analyst, the last time a descending triangle formed on the weekly chart, DOGE experienced a jaw-dropping pump of 23,200%. Now, as history could repeat itself, Martinez is keeping a close eye on a crucial resistance for confirmation. As the tweet states:
Dogecoin: The last time a descending triangle developed on the weekly chart DOGE pumped 23,200%. I’ll be looking at a sustained monthly close above $0.80 for confirmation.
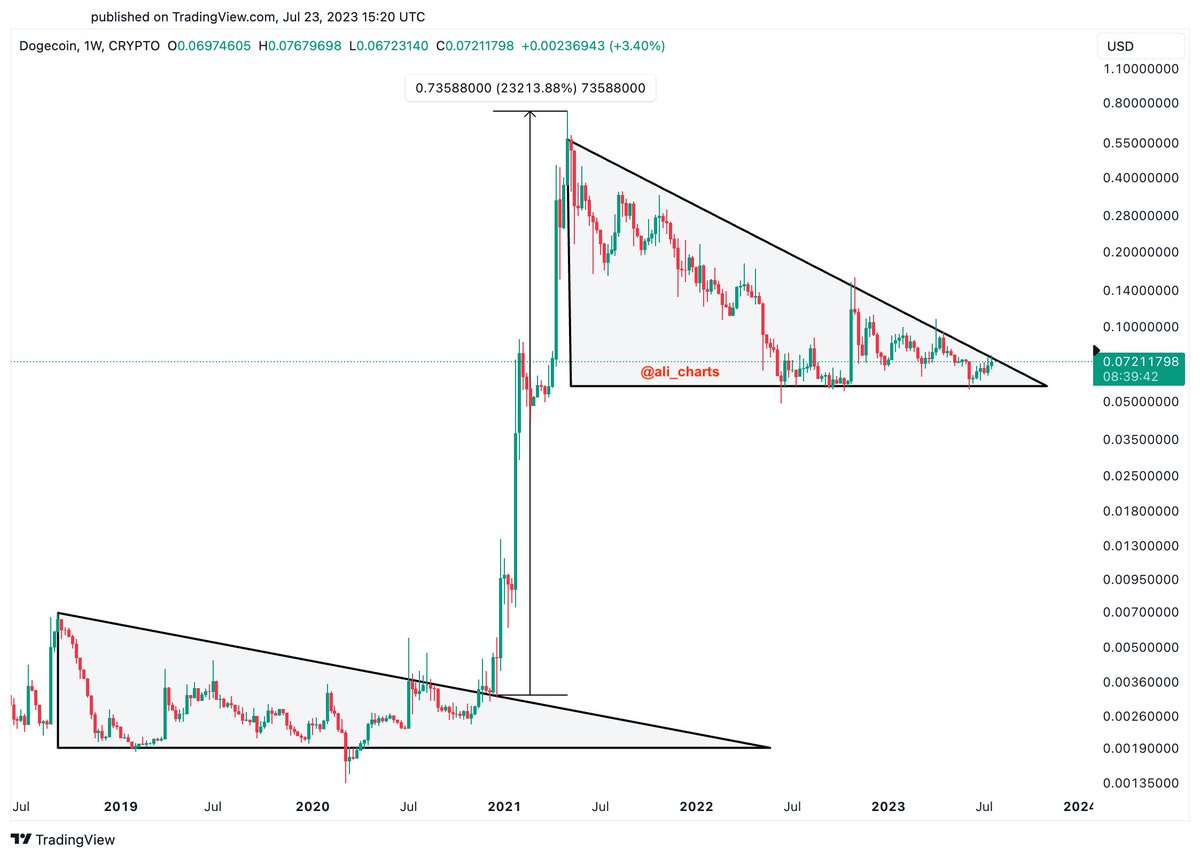
The journey for Dogecoin has been quite the rollercoaster ride. Back in January 2018, DOGE reached an all-time high of nearly $0.02, only to enter a prolonged phase of consolidation, forming the descending triangle over the next three years.
However, with the onset of the new bull market, catalyzed by Bitcoin’s momentum, DOGE finally managed to break out of its extended consolidation pattern, surging to a peak of $0.7588 on May 8.
Dogecoin Price Analysis 1D Chart
Taking a closer look at the 1-day chart, it becomes evident that Dogecoin is now facing a critical turning point. Will the price manage to reverse its trend, or will it succumb to a continuation of the downtrend after a short pause of bullish activity?
In the case of Dogecoin, the ascending triangle could signal a trend reversal. Since DOGE reached the local high of $0.1591 on November 01, 2022 as a result of the hype surrounding Elon Musk’s acquisition of Twitter, DOGE has been in a clear downtrend. From November to mid-June, DOGE has written lower highs, lower lows on the 1-day chart.
But since hitting a 13-month low at $0.0536 on June 10, DOGE has shown signs of an uptrend, forming what’s known as an ascending triangle. This particular pattern falls under the category of consolidation formations, usually indicating a continuation of the previous trend after a brief period of consolidation. However, in exceptional circumstances, such as this one, an ascending triangle can signal a trend reversal.
As the Dogecoin community eagerly awaits the potential implications of this ascending triangle, it is essential to observe the resistance levels that lie ahead. Dogecoin must confirm the pattern by continuing its upward trajectory and break through the $0.075 resistance. This level has proven to be a formidable barrier in the past, as three previous attempts to breach it were unsuccessful.
In the event of a successful breakout, the first hurdle lies at $0.0783, marked by the 23.6% Fibonacci retracement level. Should DOGE surpass this resistance, a rise to $0.0936 becomes a realistic possibility, where the 38.2% Fibonacci retracement level is situated.
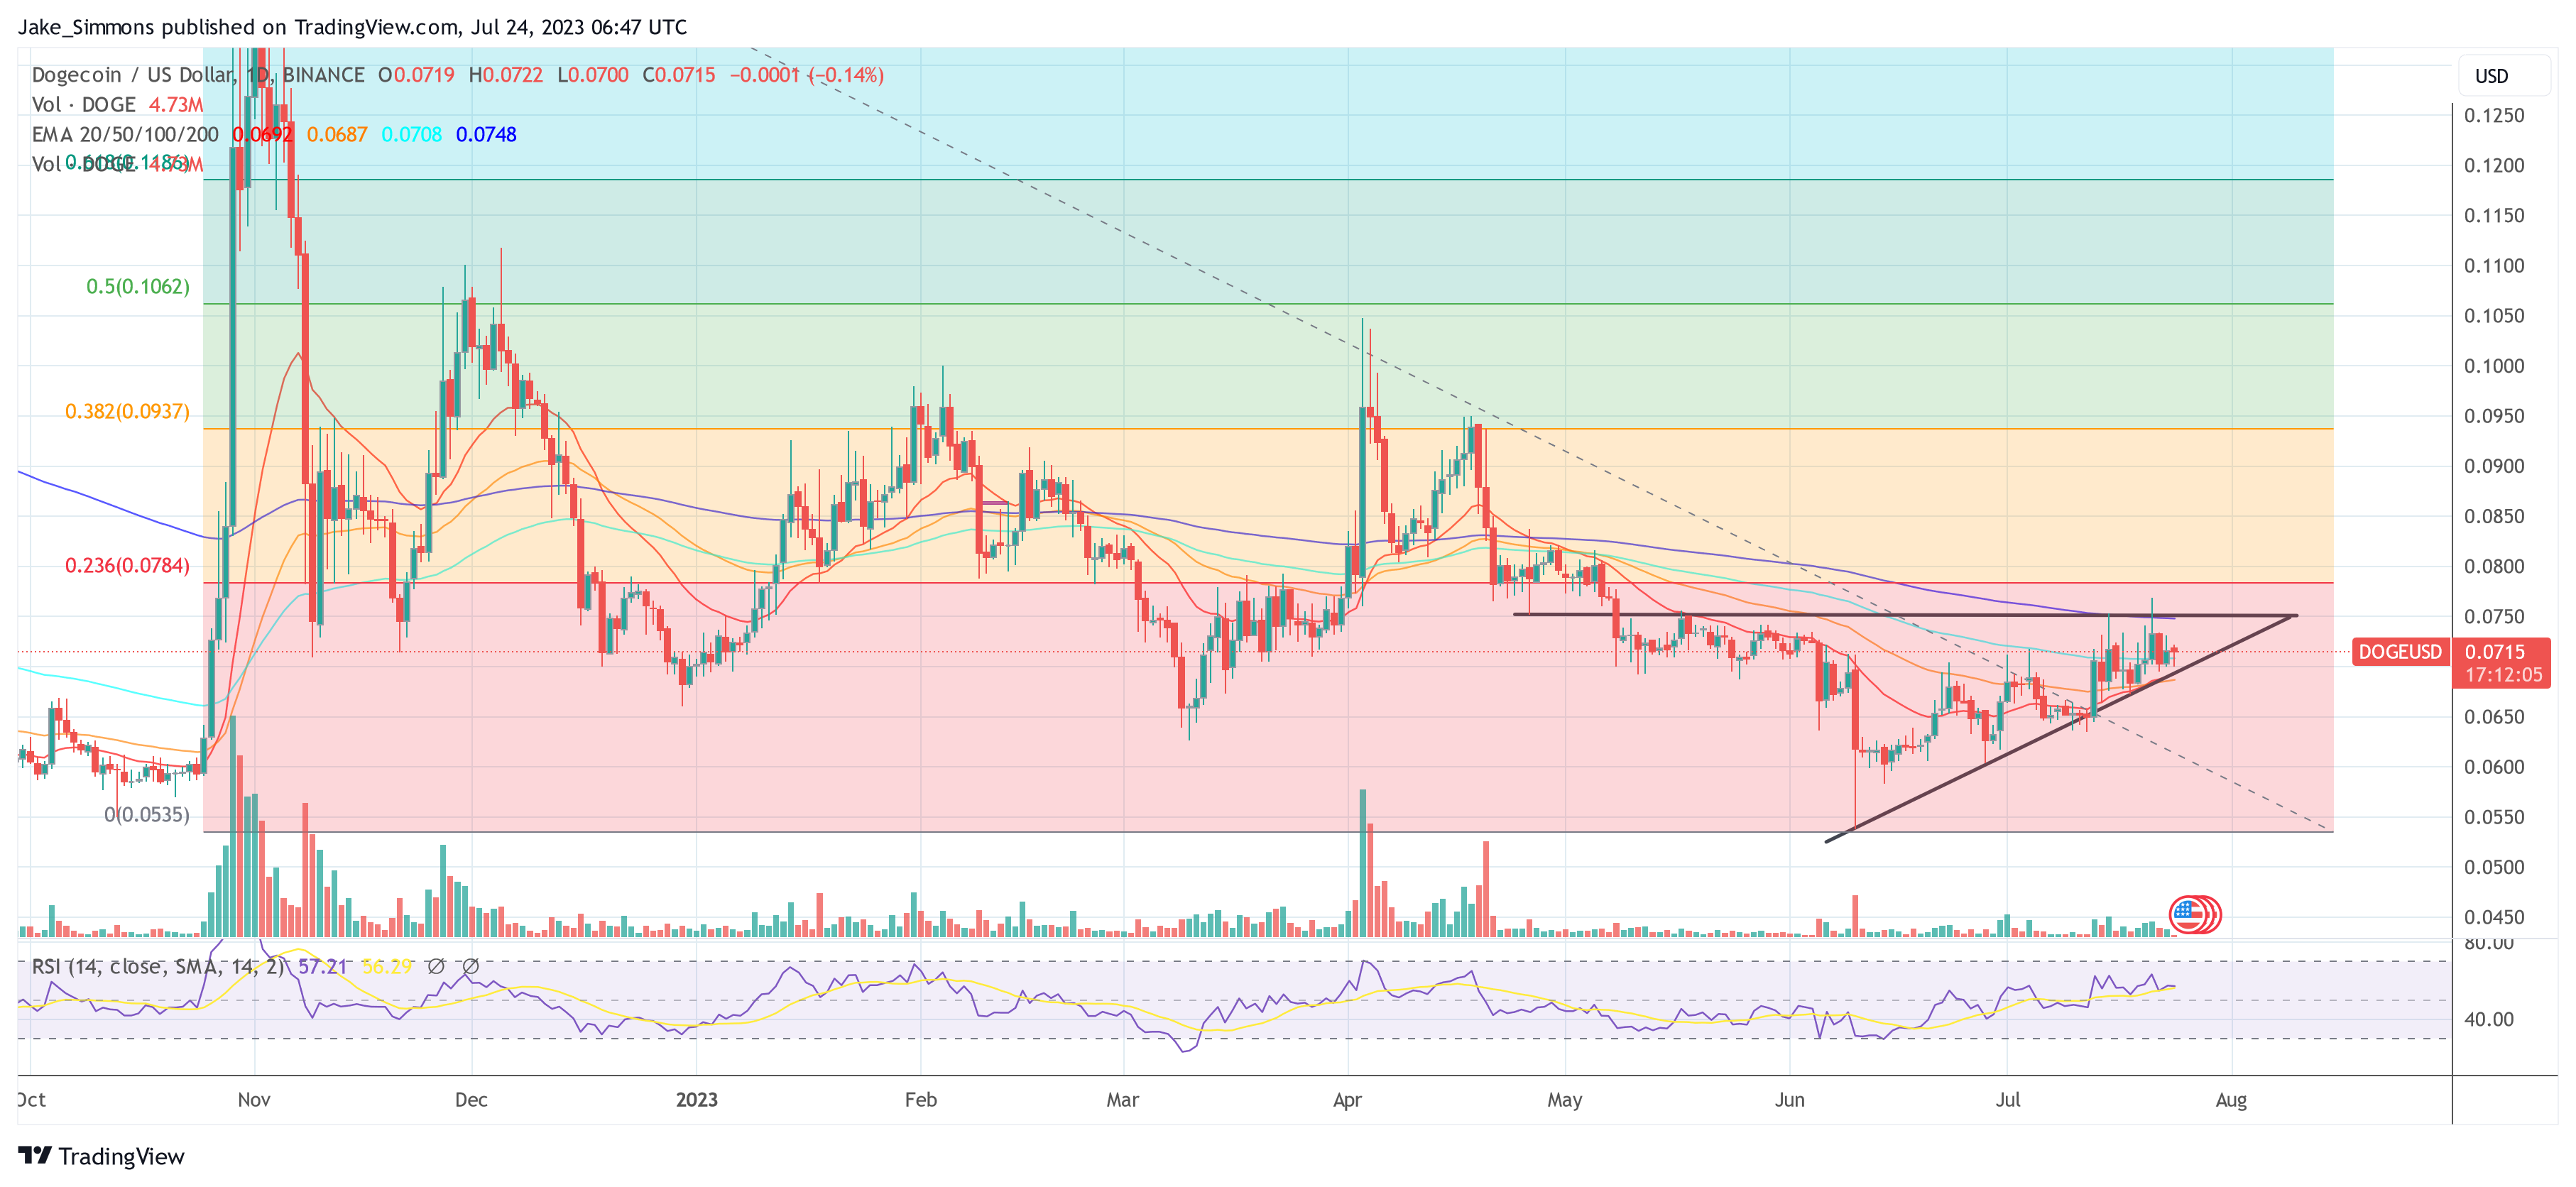
Further bullish targets include $0.1036 (50% Fibonacci retracement level), $0.1186 (61.8% Fibonacci retracement level), and $0.1363 (78.6% Fibonacci retracement level). Ultimately, reaching the previous high of $0.1591 from November 2022 would be the most ambitious goal, although the potential for heightened selling pressure at that point remains a consideration.
Currently, a drop below $0.07 would invalidate the ascending triangle theory. Should this happen, the first bearish target could be $0.0636. Then, the yearly low at $0.0536 could come into focus.
Featured image from iStock, chart from TradingView.com
- SEO Powered Content & PR Distribution. Get Amplified Today.
- PlatoData.Network Vertical Generative Ai. Empower Yourself. Access Here.
- PlatoAiStream. Web3 Intelligence. Knowledge Amplified. Access Here.
- PlatoESG. Automotive / EVs, Carbon, CleanTech, Energy, Environment, Solar, Waste Management. Access Here.
- BlockOffsets. Modernizing Environmental Offset Ownership. Access Here.
- Source: https://www.newsbtc.com/news/dogecoin/history-repeating-dogecoin-monthly-chart-massive-rally/

