In data-driven business operations, the significance of effective data management and analysis cannot be overstated. Excel, a legacy software tool, has long been the cornerstone of such endeavors, offering robust capabilities for data manipulation and presentation. Nevertheless, as operational intricacies escalate and data volumes surge, the limitations of manual data handling become increasingly pronounced.
Imagine a landscape where the repetitive tasks that consume your time are transformed into seamless, automated processes. Envision a scenario where intricate analyses are executed at the click of a button, and critical insights hidden within your data are unveiled effortlessly. Welcome to the world of Excel automation.
Join us as we decode the mechanics of macros, harness the capabilities of functions and formulas, wield the transformative force of Power Query and Power Pivot, and delve into the myriad possibilities that arise from seamlessly integrating Excel with an array of interconnected applications.
What is Excel Automation?
Excel automation is a transformative approach to using Microsoft Excel that involves leveraging various tools and techniques to streamline and expedite tasks within Excel workbooks. It shifts the focus from manual data entry and repetitive actions to creating automated workflows that enhance efficiency, accuracy, and productivity. Through a combination of macros, functions, formulas, and advanced features like Power Query and Power Pivot, Excel automation empowers users to create sophisticated solutions that save time, reduce errors, and unlock the full potential of their data.
Nanonets is used by enterprises worldwide to extract text and tables from images; PDFs scanned documents, and more with a simple-to-use, intuitive & no-code platform.
Why is Excel Automation Important?
- Efficiency: Excel automation reduces the time and effort required to perform tasks, allowing users to focus on more value-added activities.
- Accuracy: Manual data entry is prone to errors. Automation ensures data accuracy, reducing the risk of costly mistakes.
- Consistency: Automated processes yield consistent results, even across large datasets or complex calculations.
- Scalability: As tasks become more intricate or volumes of data increase, automation ensures scalability without proportional increases in effort.
- Strategic Decision-Making: Automated reports, dashboards, and visualizations enable faster and more informed decision-making.
- Competitive Edge: Organizations that harness Excel automation gain a competitive advantage by optimizing workflows and improving operational agility.
- Integration: Excel automation facilitates integration with other software, databases, and systems, ensuring data flows seamlessly.
- Modernization: Excel automation bridges the gap between legacy processes and contemporary data-driven practices, enabling businesses to evolve.
In essence, Excel automation transforms Excel from a basic spreadsheet tool into a dynamic platform capable of handling complex tasks and delivering actionable insights. By embracing automation, users unlock the full potential of their data, transcend traditional limitations, and chart a course towards enhanced productivity and success.
What Kind of Excel Tasks can be Automated?
- Data Entry and Cleaning: Automate data entry by setting up data validation rules, drop-down lists, and default values to ensure consistent and accurate data input.
- Report Generation: Automate the creation of reports by using macros to pull data from various sources and populate predefined templates. Create dynamic templates that update with new data or parameters, ensuring that reports are always up-to-date.
- Data Visualization: Automate data visualization using conditional formatting to highlight specific data points based on criteria. Create automated charts and graphs that update as new data is entered, providing real-time insights.
- Repetitive Formatting: Automate formatting tasks such as applying consistent fonts, colors, and styles to cells and ranges. Use macros to automate the application of specific formatting to ensure consistency across worksheets.
- Data Import and Export: Automate the import of data from external sources, such as databases or text files, using Power Query. Export data to other formats, such as CSV or PDF, using macros or built-in Excel functionalities.
- Data Validation and Error Checking: Automate data validation rules to ensure that only valid data is entered into cells. Use macros to set up error-checking routines that identify and highlight data inconsistencies or anomalies.
- Scenario Analysis and Modeling: Automate scenario analysis by creating scenarios with different assumptions and using Goal Seek or Solver to find optimal solutions. Automate sensitivity analysis by using data tables to analyze various combinations of inputs.
- Alerts and Notifications: Automate alerts based on certain conditions or thresholds in the data.
Looking to automate data entry from documents to Excel? Try Nanonets OCR software to extract data from documents and export to excel in minutes with 98%+ accuracy. Start free trial today.
Which Industries Can Benefit from Excel Automation?
- Finance and Banking: Financial institutions deal with vast amounts of data, including transaction records, account balances, investment portfolios, and risk assessments. Excel automation can streamline financial analysis, reporting, budgeting, and regulatory compliance processes.
- Retail and E-Commerce: Retail businesses manage inventory, sales data, customer information, and pricing strategies. Excel automation can optimize inventory management, sales forecasting, pricing analysis, and customer segmentation.
- Healthcare and Pharmaceuticals: Healthcare professionals track patient data, medical records, clinical trials, and drug research. Excel automation can expedite data analysis for research, streamline patient record management, and aid in medical billing processes.
- Manufacturing and Supply Chain: Manufacturers handle production schedules, inventory tracking, quality control, and supply chain management. Excel automation can enhance inventory optimization, demand forecasting, production scheduling, and vendor management.
- Human Resources: HR departments manage employee data, payroll, recruitment, and performance evaluations. Excel automation can simplify payroll calculations, automate onboarding processes, and generate HR reports.
- Real Estate: Real estate professionals deal with property data, sales records, rental agreements, and market analysis. Excel automation can assist in property valuation, cash flow analysis, and generating property reports.
- Consulting and Professional Services: Consultants analyze data for clients, generate reports, and provide strategic recommendations. Excel automation can expedite data analysis, streamline report generation, and improve consulting services.
- Education and Academia: Educational institutions handle student records, academic data, research findings, and administrative tasks. Excel automation can enhance grade calculations, automate data entry, and assist in research analysis.
- Nonprofit and Government: Nonprofit organizations and government agencies deal with donor data, program outcomes, and budgeting. Excel automation can simplify grant tracking, automate financial reporting, and improve transparency.

Excel’s versatility makes it a preferred tool for data analysis and management across sectors. However, as industries continue to evolve, the limitations of manual Excel usage become apparent, and automation becomes crucial to handling larger volumes of data efficiently and accurately.
Ultimately, any industry that relies on data for decision-making, reporting, and process optimization can benefit from Excel automation to enhance productivity, accuracy, and insights.
What are the Tools and Techniques for Excel Automation?
Macros
Macros are sequences of recorded actions that can be replayed to automate repetitive tasks. They allow users to automate a series of commands or actions within Excel, such as formatting, data entry, and calculations. Macros are particularly useful for automating tasks that involve multiple steps. Excel’s built-in Visual Basic for Applications (VBA) editor is used to create, edit, and manage macros.
Macros are sequences of recorded actions that can be replayed to automate tasks. To get started, follow these steps:
- Navigate to the “View” tab and click on “Macros.”
- Choose “Record Macro” and perform the actions you want to automate.
- Stop recording and save the macro.
- Run the macro whenever you need to perform those actions again.
Imagine you frequently receive a dataset with messy formatting. Instead of manually cleaning it up each time, you can record a macro that performs the necessary cleaning tasks—like removing extra spaces, converting text to proper case, and formatting dates uniformly. Whenever you receive a new dataset, you can run this macro to automate the cleaning process.
Formulas and Functions
This is the most commonly used technique of Excel automation. Excel’s wide range of formulas and functions enable users to automate calculations, data transformations, and logic-based operations. Functions like VLOOKUP, HLOOKUP, INDEX-MATCH, and SUMIF can retrieve and manipulate data efficiently. Functions can be combined to create complex formulas that perform calculations across multiple cells or datasets.
Power Query
Power Query is a powerful tool that facilitates data transformation and integration. It allows users to connect to various data sources, combine and shape data, and load the refined data into Excel. Power Query’s intuitive interface enables users to perform tasks such as filtering, sorting, merging, and data cleaning. Once defined, Power Query transformations can be refreshed with new data automatically.
For instance, you have data from multiple Excel files that need to be combined into a single report. Instead of manually copying and pasting, you can use Power Query to import data from each file, transform and clean it, and then merge the data into a single table. This automation ensures that whenever new files are added, the report can be updated with a simple refresh.
Power Pivot
Power Pivot is an Excel add-in that extends the capabilities of traditional PivotTables. It enables users to work with larger datasets and create complex relationships between tables. Power Pivot allows users to build advanced data models, create calculated columns and measures, and generate PivotTables and PivotCharts based on these models.
For instance, suppose you have sales data in one table and customer information in another. Using Power Pivot, you can create a relationship between these tables. Then, you can build a PivotTable that summarizes sales by customer, including customer details from the other table. As new sales data is added, the PivotTable updates automatically.
Data Validation and Conditional Formatting
Data validation ensures data accuracy by limiting what can be entered into specific cells. Conditional formatting automates cell formatting based on specific conditions, making it easy to highlight trends, anomalies, or data patterns.
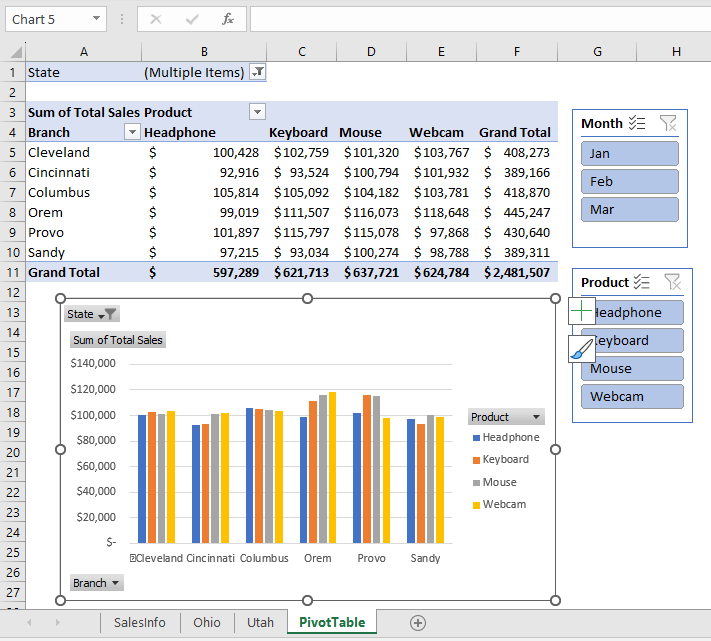
PivotTables and PivotCharts
PivotTables allow users to summarize, analyze, and visualize large datasets quickly. By simply dragging and dropping fields, users can create custom reports without writing complex formulas. PivotCharts provide graphical representations of PivotTable data, aiding in data visualization.
Another tool that is used quite often by analysts. For example, you have a large dataset of customer orders and want to analyze sales by product category. By creating a PivotTable, you can drag the “Product Category” field to the rows area and the “Sales Amount” field to the values area. Excel will automatically generate a summarized report of sales by category. You can then create a PivotChart to visualize this data.
Solver
Solver is an Excel add-in used for optimization and decision-making. It helps users find the optimal solution to a problem by adjusting variables while adhering to constraints. It’s commonly used for tasks like resource allocation, budget optimization, and scheduling.
Data Analysis Toolpak
The Data Analysis Toolpak is an Excel add-in that offers a suite of data analysis tools. It includes features like regression analysis, correlation calculations, histogram generation, and more. These tools assist in performing advanced statistical analysis without requiring extensive mathematical knowledge.

Visual Basic for Applications (VBA)
VBA is a programming language integrated into Excel that enables users to create custom macros, automate processes, and develop user-defined functions. With VBA, users can create automated solutions tailored to their specific needs.
VBA is a little more complex but its output is much more comprehensive. For example, you receive monthly sales reports that need to be consolidated and summarized. With VBA, you can create a custom macro that automatically imports data from each report, cleans and formats it, and then generates a master report with summarized information.
Add-Ins and Integrations
Excel can be extended through various add-ins and integrations. Users can leverage third-party add-ins to enhance data visualization, integrate Excel with other software applications, or even use programming languages like Python to perform advanced data analysis and automation. Obviously being a Microsoft product, Excel allows a multitude of integrations. A good example of a real-world situation can be if you’re working on a financial analysis that requires advanced statistical calculations. You can use an add-in like the XLSTAT Excel add-in, which offers a suite of statistical tools. By integrating Python into Excel, you can perform sophisticated data analysis using Python libraries and frameworks directly within your Excel workbook.
These tools and techniques collectively provide a robust toolkit for Excel automation. Depending on the complexity of the task, users can choose the appropriate tool or combination of tools to automate processes, enhance data analysis, and optimize workflow efficiency.
Limitations of Excel Automation
Excel automation offers numerous benefits, but it’s essential to acknowledge its limitations and challenges. One significant limitation lies in the complexity of tasks it can handle. While Excel is versatile, intricate processes involving multiple variables, advanced statistical analyses, or machine learning algorithms often exceed its capabilities. Attempting to automate highly complex tasks within Excel might result in convoluted solutions that are difficult to manage, leading to errors and reduced efficiency.
Another challenge is scalability. As data volumes grow, Excel’s performance can diminish. Large datasets may lead to slow calculations, delayed refresh times, and increased risk of crashes. This limitation can hinder real-time decision-making and compromise user experience. Moreover, collaboration on complex automated workbooks can be cumbersome, especially when multiple users attempt to modify and run macros simultaneously. Ensuring version control, data integrity, and proper user access becomes increasingly challenging.
Excel automation also grapples with data security concerns. While Excel provides password protection and encryption options, they may not suffice for safeguarding sensitive data. Macros and automated processes can potentially expose vulnerabilities, leading to data breaches or unauthorized access. Organizations with strict data security requirements might find Excel automation less suitable for handling confidential information.
Maintaining and troubleshooting complex automated solutions in Excel can be labor-intensive. Debugging errors within intricate macros or formulas can be time-consuming, especially when multiple dependencies are involved. Additionally, the reliance on specific versions of Excel, compatibility issues with different operating systems, and software updates can impact the stability of automated solutions, leading to unexpected errors.
Another limitation is the lack of centralized control and monitoring. Unlike dedicated automation platforms, Excel lacks robust features for centralized management, scheduling, and monitoring of automated tasks. As a result, tracking the status and performance of automated processes, especially when spread across different workbooks, becomes challenging. This deficiency can hinder efficient oversight and management of automated workflows.
In conclusion, while Excel automation offers a powerful toolkit for streamlining tasks and enhancing data analysis, it is not without its limitations and challenges. Organizations must carefully assess the complexity, scalability, security, maintenance, and monitoring requirements of their automated solutions to determine whether Excel remains the optimal choice or if more specialized automation platforms are necessary to address these challenges effectively.
Supercharge your Excel data parsing workflows with Nanonets. Automatically modify your Excel data in any way you prefer.
- SEO Powered Content & PR Distribution. Get Amplified Today.
- PlatoData.Network Vertical Generative Ai. Empower Yourself. Access Here.
- PlatoAiStream. Web3 Intelligence. Knowledge Amplified. Access Here.
- PlatoESG. Automotive / EVs, Carbon, CleanTech, Energy, Environment, Solar, Waste Management. Access Here.
- PlatoHealth. Biotech and Clinical Trials Intelligence. Access Here.
- ChartPrime. Elevate your Trading Game with ChartPrime. Access Here.
- BlockOffsets. Modernizing Environmental Offset Ownership. Access Here.
- Source: https://nanonets.com/blog/excel-automation/

