
Published 8 hours ago
Ethereum Price Prediction: The ongoing consolidation in Ethereum price hit a minor roadblock at $1800 psychological support and has turned sideways for nearly a week now. Amid the consolidation phase, the price resonated between two converging trendlines revealing the formation of a bearish flag. Here’s how this pattern may influence the Ethereum coin’s future trend.
advertisement
Key Points:
- The Ethereum price narrowing within two trendlines can be considered a no-trading zone
- The coin price breakout on either side will determine the potential trend in ETH
- The intraday trading volume in Ether is $9.04 Billion, indicating a 42.5% gain.
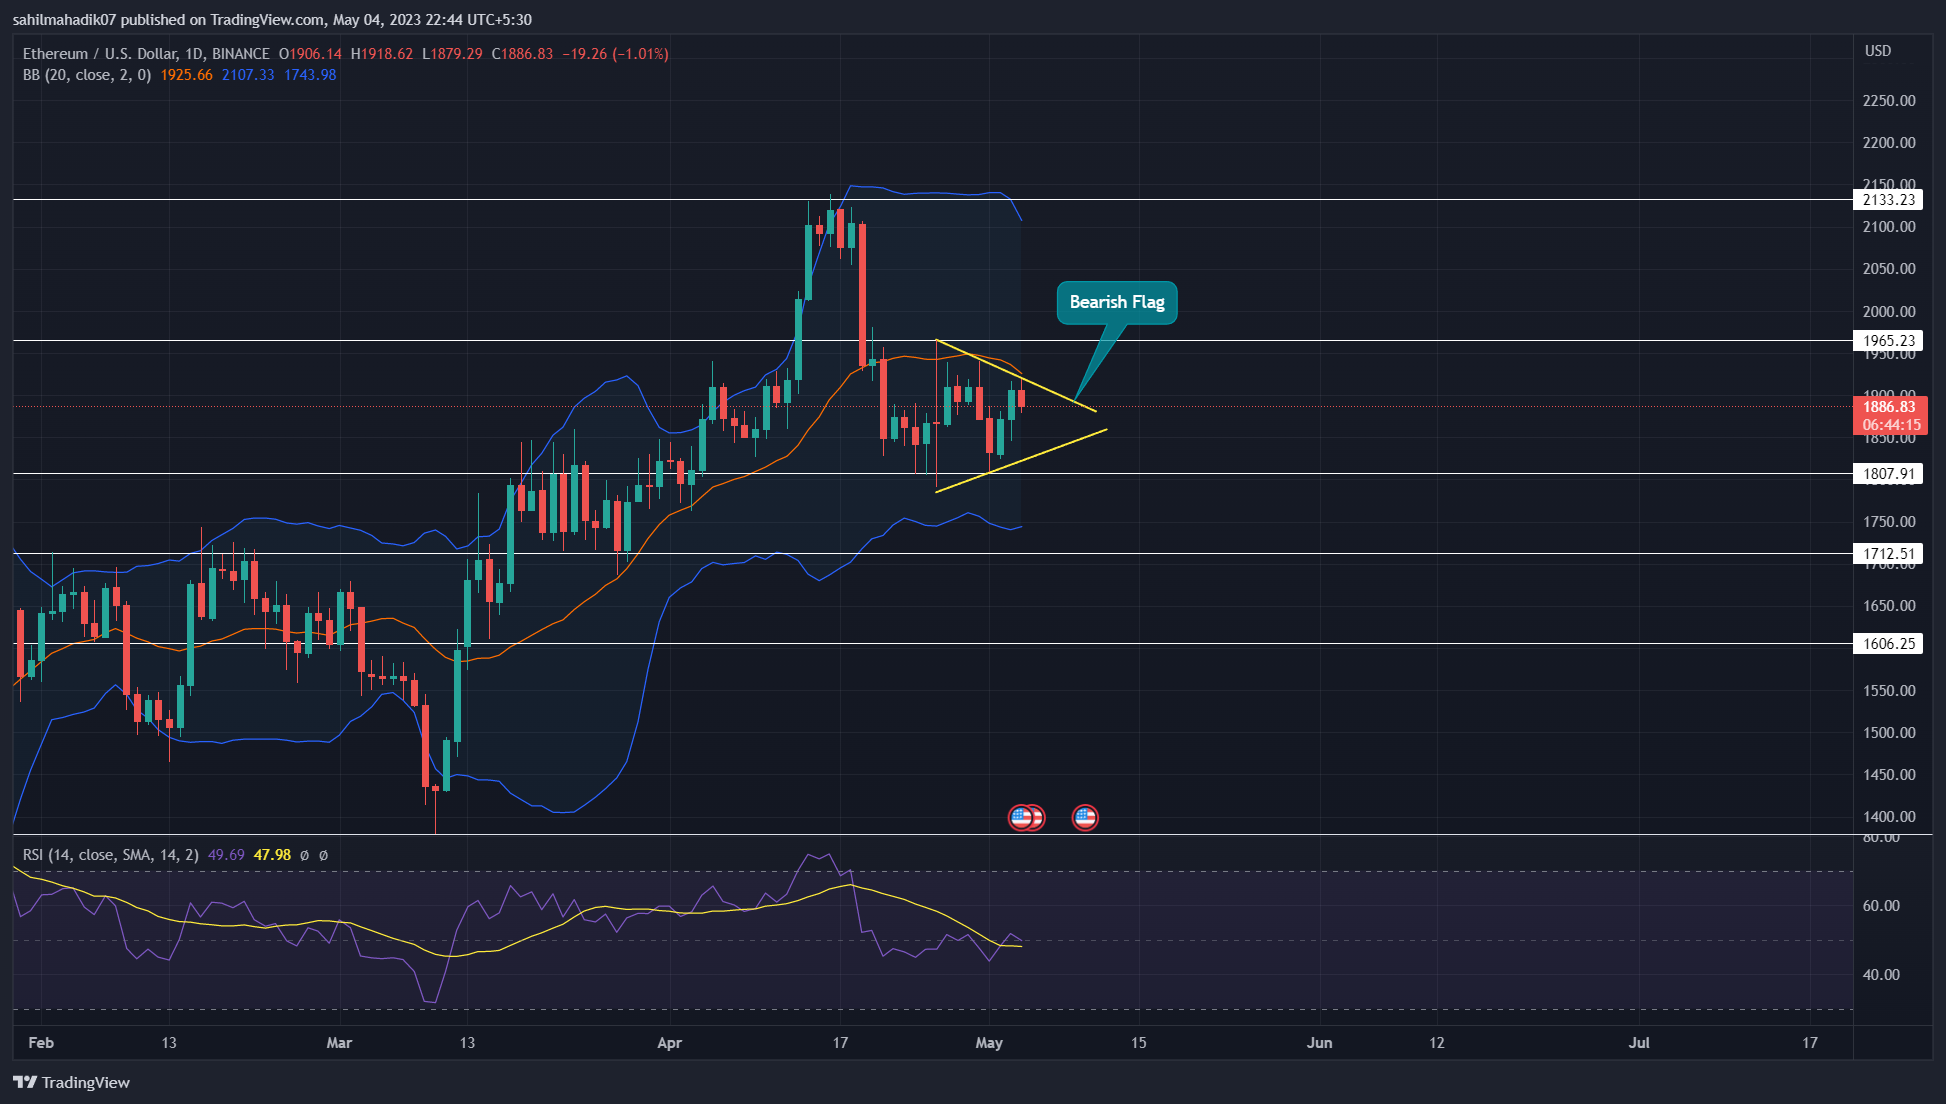
Source- Tradingview
On May 3rd, the US Fed announced a 25 basis points rate hike during the FOMC meeting. The crypto market reacted positively to these expected numbers, triggering a minor uptick in several cryptocurrencies.
However, the Ethereum price still within the triangle pattern indicated uncertainty among market participants. With a 1% intraday fall, the coin price turned down from the pattern’s resistance trendline indicating a prolonged consolidation phase.
Trending Stories
Also Read: Top 10 Crypto Margin Trading Platforms In Australia
Anyhow, the bearish pattern creates a higher possibility for a breakdown below the support trendline and resumes the prevailing downfall. A daily candle closing below the trendline will increase the selling pressure and tumble the Ethereum price 10% down to hit $1650.
On a contrary note, a breakout above the overhead trendline will signal the belonging of a fresh recovery rally which may surge the price back to the last swing high of $2133.
Technical Indicator
Relative Strength Index: The daily RSI slope wavering around the neutral line accentuates an indecisive market sentiment.
Bollinger Band: The Ethereum price flipped the midline of the Bollinger band indicator into a viable resistance offering sellers an additional resistance to pressurize buyers for longer correction.
Ethereum Coin Price Intraday Levels-
- Spot rate: $1884
- Trend: Bearish
- Volatility: High
- Resistance level- $1965 and $2133
- Support level- $1800 and $1700
Share this article on:
advertisement
The presented content may include the personal opinion of the author and is subject to market condition. Do your market research before investing in cryptocurrencies. The author or the publication does not hold any responsibility for your personal financial loss.
<!– Close Story–>
- SEO Powered Content & PR Distribution. Get Amplified Today.
- PlatoAiStream. Web3 Data Intelligence. Knowledge Amplified. Access Here.
- Minting the Future w Adryenn Ashley. Access Here.
- Buy and Sell Shares in PRE-IPO Companies with PREIPO®. Access Here.
- Source: https://coingape.com/markets/ethereum-price-prediction-bearish-pattern-plots-8-drop-in-eth-price-time-to-reaccumulate/

