
Published 2 hours ago
The Ethereum price has been in a correction phase for the past three weeks, where the altcoin plunged from the peak of $2138 to the current price of $1831, registering a loss of 14.8%. This bearish pullback is still above the 38.2% Fibonacci retracement level indicating the overall sentiment is bullish. However, a new bearish pattern emerged in the daily chart indicating the correction phase is likely to extend before the buyers retake trend control.
advertisement
Key Points:
- Ethereum Fear and Greed Index at 48% reflect a neutral sentiment among market participants
- A breakdown below neckline support of head and shoulder pattern will put Ethereum at risk of prolonged downfall
- The intraday trading volume in Ether is $7.18 Billion, indicating a 17.5% loss.
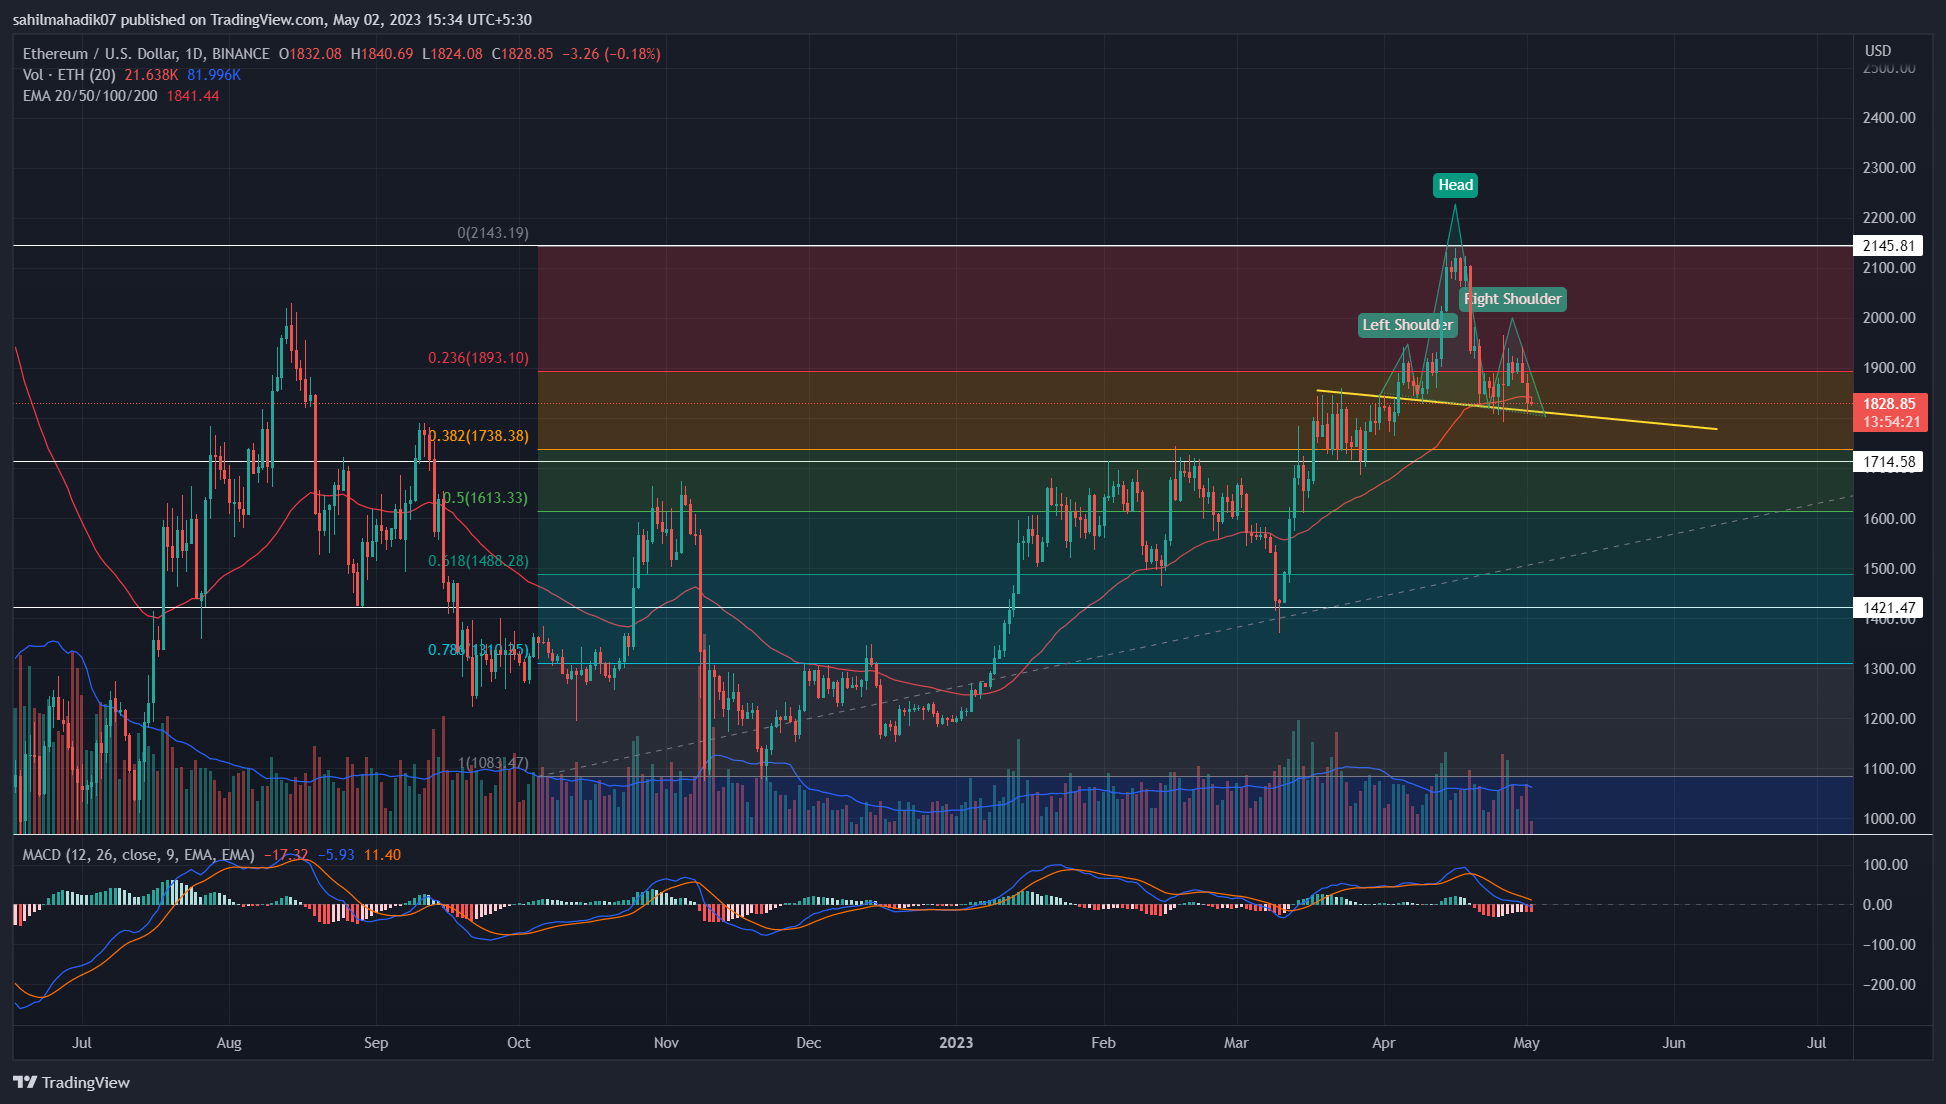
Source- Tradingview
Today, the Ethereum price shows an intraday loss of 0.22% and continues to hover above the neckline support trendline of the head and shoulder pattern. As of now, the crypto market remains uncertain and eagerly waits for the Federal Reserve’s interest rate decision and FOMC conference on May 3rd.
An anticipated hawkish stance from these macroeconomic events will likely accelerate the selling pressure in the crypto market. Thus, a potential breakdown from the aforementioned neckline support for Ethereum price hints at the resumption of the ongoing correction.
Trending Stories
Also Read: FOMC,ECB: Bitcoin To Face Tough Week Ahead; Here’s Why
A daily candle below will offer sellers an additional barrier to pressurize buyers and tumble the ETH price 17.5% down to hit $1500 psychological support
Conversely, if the Ethereum price manages to sustain above $1820 or support amid Fed’s interest rate decision or FOMC conference, the buyers can breach the $1950 immediate resistance to undermine this correction and rechallenge the $2138 peak.
Technical Indicator
Moving Average Convergence/Divergence: Along with the neckline breakdown, the MACD(blue) and signal(orange) slope potential dive below the neutral level will give additional confirmation for the bearish trend.
Exponential Moving Average: A breakdown below the 50-day EMA slope after 7 weeks increases the negative sentiment in the market.
Ethereum Coin Price Intraday Levels-
- Spot rate: $1829
- Trend: Bearish
- Volatility: High
- Resistance level- $1940 and $2011
- Support level- $1840 and $1770
Share this article on:
advertisement
The presented content may include the personal opinion of the author and is subject to market condition. Do your market research before investing in cryptocurrencies. The author or the publication does not hold any responsibility for your personal financial loss.
<!– Close Story–>
- SEO Powered Content & PR Distribution. Get Amplified Today.
- PlatoAiStream. Web3 Data Intelligence. Knowledge Amplified. Access Here.
- Minting the Future w Adryenn Ashley. Access Here.
- Source: https://coingape.com/markets/with-feds-interest-decision-this-week-will-ethereums-price-rise-2k-drop-1-5k/

