SNEAK PEEK:
- Over the course of ten weeks, Ethereum 2.0 stakers have seen a significant decrease in their realized value.
- Long-term stakers are now down an average of 31% as ETH token prices remain volatile.
- Despite average losses in the market, ETH stakers and long-term holders are still confident that Ethereum prices will rally.
Ethereum 2.0 investors have been dealing with significant losses, as seen in their realized values over the past ten weeks. The chart shared in Santiment’s tweet indicates that the realized value of ETH 2.0 stakers has been on a steady decline as of late, with a drop-off of 31% over the 10-week period.
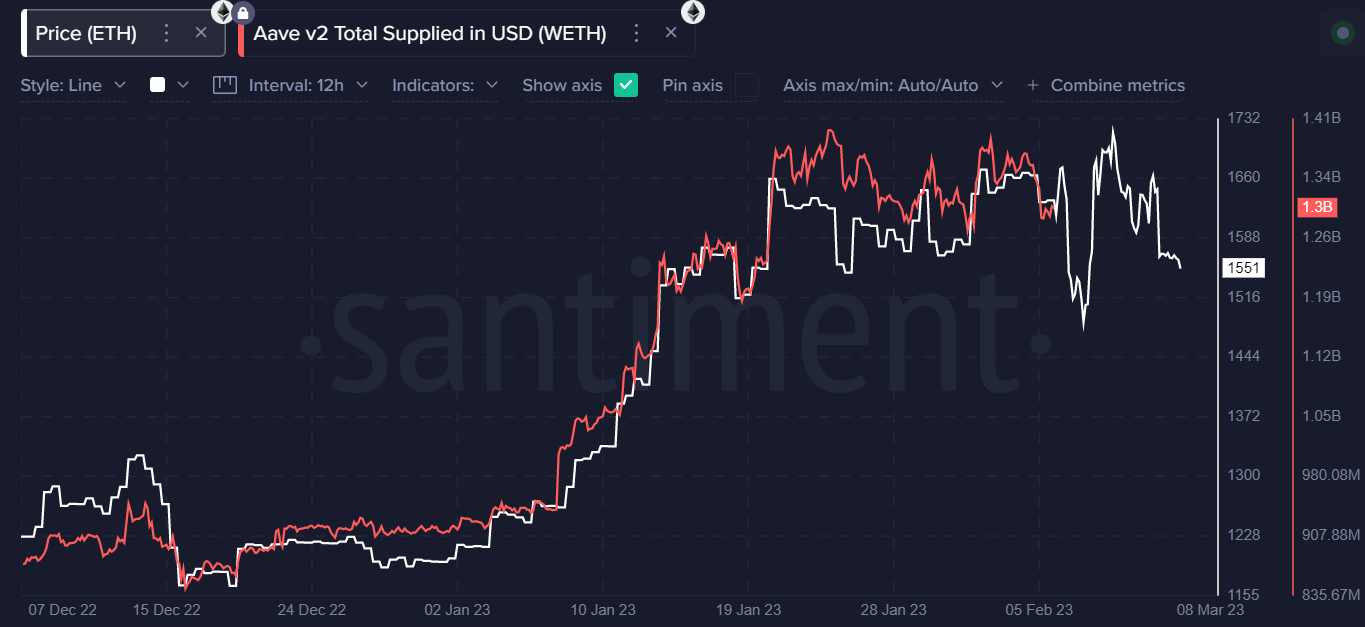
The decrease in ETH price has been a major factor in the decline in realized values for stakers and long-term holders. Despite this fact, Ethereum investors remain confident that prices will eventually rebound. The Santiment template provides a valuable resource for Ethereum 2.0 and Aave V2 holders to stay informed on the latest supply information, aiding them in making better investing decisions.
As ETH continues to experience extreme price volatility, it is likely that investors who have held through this period will be faced with further losses. Despite these losses, many ETH stakers and long-term holders remain optimistic about the future of Ethereum. With the help of resources such as those provided by Santiment, investors can make better decisions in this unpredictable market.
Looking at today’s market, Ethereum price analysis shows that the ETH/USD pair is still on the decline. The latest analysis of ETH/USD is currently at $1,554, down 0.75% for the last 24 hours. Selling pressure is still high on Ethereum, as the market remains incredibly volatile. Additionally, Ethereum 2.0 stakers and investors will have to continue to monitor the market closely if they wish to hold on for future profits.
The support and resistance levels of Ethereum have been identified at $1,543 and $1,568, respectively, which may provide some stability to the Ethereum market. The current market cap of Ethereum is around $190 billion, while the trading volume of ETH/USD has reached $7.2 billion over the past 24 hours.
The technical indicators are still in a bearish stance, despite the recent decrease in prices. The MACD and RSI levels have both dropped into the bearish range, indicating that further losses might be on the way. The Bollinger bands are also narrowing, which is another sign that the market could see further lows.
The upper Bollinger band is currently located at $1,722, while the lower Bollinger band is located at $1,528. If Ethereum prices keep on decreasing, the lower Bollinger band will be tested soon, and if Ethereum prices start to rally, the upper Bollinger band will be tested.
Overall, it appears that Ethereum 2.0 stakers and long-term holders may have to continue dealing with losses if ETH prices remain volatile in the near future. Investors should stay informed about the latest market conditions and use resources such as Santiment’s template to make more informed decisions about their investments in Ethereum.
Disclaimer: In good faith, we disclose our thoughts and opinions in our price analysis and all the facts we give. Each reader is responsible for his or her investigation. Reader discretion is advised before taking any action
- SEO Powered Content & PR Distribution. Get Amplified Today.
- Platoblockchain. Web3 Metaverse Intelligence. Knowledge Amplified. Access Here.
- Source: https://investorbites.com/ethereum-eth-price-analysis-08-03/

