SNEAK PEAK
- Ethereum price analysis indicates a downtrend in the crypto as bearish sentiment mounts.
- ETH token is trading at $1,815, which is down by 3.05 per cent over the past few hours.
- The cryptocurrency is facing strong rejection at $1,874 after a bearish run.
The latest Ethereum price analysis reveals that the market is being driven by bearish sentiment, with selling pressure dominating. At the time of analysis, ETH was trading at $1,815, down by 3.05 percent in the past few hours. The coin had experienced a sharp decline in its price after reaching a peak of $1,911 earlier this week when bullish sentiment was dominant.
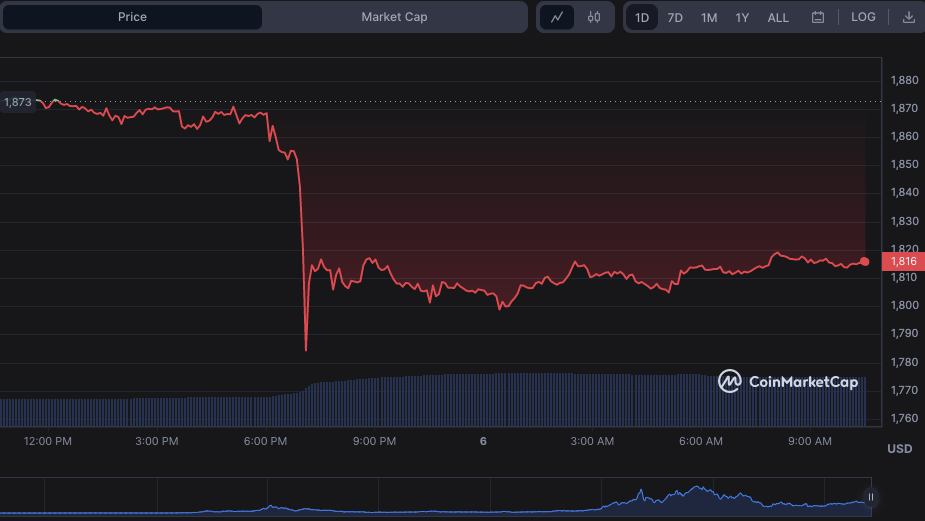
The current bearish momentum is taking the price of the coin toward $1,780, which is currently acting as the nearest support. If the price falls below this level, it will enter a bearish zone, which might take it toward the $1,750 level in the coming days. On the upside, if ETH can break above $1,874 soon, then we can expect further upward movement.
In the past 24 hours, the bullish and bearish forces have taken turns controlling the market, with the bearish side having the upper hand. The bearish momentum is expected to continue in the short term as the sellers take over the market. The trading volume for the coin has also declined substantially to $8.67 billion in the past few hours, indicating a lack of buying pressure.
The four-hour technical indicator readings are also in the bearish region, with MACD showing a negative divergence. The MACD line (blue) has crossed below the signal line at -18.36, indicating a bearish crossover. The RSI is currently at 28, 30, which indicates that the market is oversold, and there could be some support for buying soon enough. The 20-EMA line is also in the bearish region and is below the 50-EMA line, which indicates that there are more chances of the ETH price falling further.
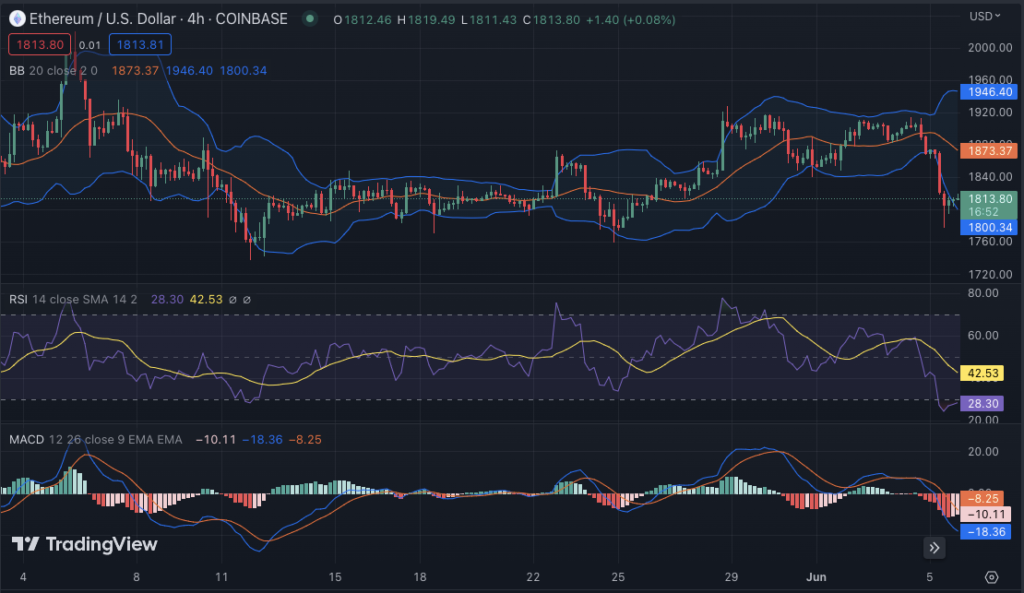
The Bollinger bands are also indicating a bearish outlook, with the price trading close to the lower band. The lower Bollinger band is currently at $1,800, and the upper band is at $1,948, indicating that the current market trend is bearish and all the indicators are pointing towards a further fall in ETH prices. Volatility is expected to remain low in the coming days as the bearish sentiment dominates.
Overall, the current bearish sentiment is expected to dominate in the near future as ETH prices remain below the $1,874 resistance level. All technical indicators support this scenario, and a further downward movement looks likely in the coming days. The bulls will need to act soon in order to reverse the current bearish momentum and take ETH prices higher.
Disclaimer: Cryptocurrency price is highly speculative and volatile and should not be considered financial advice. Past and current performance is not indicative of future results. Always research and consult with a financial advisor before making investment decisions
- SEO Powered Content & PR Distribution. Get Amplified Today.
- PlatoAiStream. Web3 Data Intelligence. Knowledge Amplified. Access Here.
- Minting the Future w Adryenn Ashley. Access Here.
- Buy and Sell Shares in PRE-IPO Companies with PREIPO®. Access Here.
- Source: https://investorbites.com/ethereum-eth-price-analysis-06-06/

