- The share price performance of Nvidia has been the main driver of Nasdaq 100 outperformance/premium against the rest of the world stock indices ex-US.
- Lofty expectations have been priced in for Nvidia ahead of its Q2 earnings release today.
- Several bearish technical elements have emerged in the share price of Nvidia.
In the past four weeks, the ongoing medium-term bullish trend in the US stock market has started to wobble due to rising longer-term “risk-free” US Treasury yields that increase the opportunity costs of owning riskier assets such as equities. The global benchmark for long-term interest rates, the 10-year US Treasury yield has staged a relentless up move since mid-July 2023 towards 4.34% on Monday, 21 August, surpassing last year’s October peak and reaching a 16-year high.
The worst hit so far in the rising US Treasuries yields environment is the “long-duration growth styled” US equities which comprises the “Magnificent Seven” group of mega-cap technology stocks that includes Apple, Microsoft, and Nvidia which in turn has a significant high combined weightage in Nasdaq 100, one of the major US benchmark stock indices.
The Nasdaq 100 has recorded a month-to-date loss of -5.4% as of 22 August, its worst monthly performance since December last year and it chalked up an impressive intra-year-to-date gain of +45.6% in July 2023 despite the US regional banking turmoil in March.
The leader of the “Magnificent Seven” is Nvidia, the graphics semiconductor chip marker where its share price soared by nearly three times in 2023, riding on the optimism of a generative artificial intelligence productivity boom.
Interestingly, after the release of Nvidia’s fiscal Q1 earnings report on 24 May 2023 that blew expectations and offered rosy revenue guidance which in turn triggered a further widening of Nasdaq 100’s outperformance/premium against the rest of the world stock indices excluding the US as represented by the MSCI All Country Index ex- US exchange-traded fund (see Fig 1. Chart).
Nvidia’s share price performance is the main contributor to Nasdaq 100 outperformance
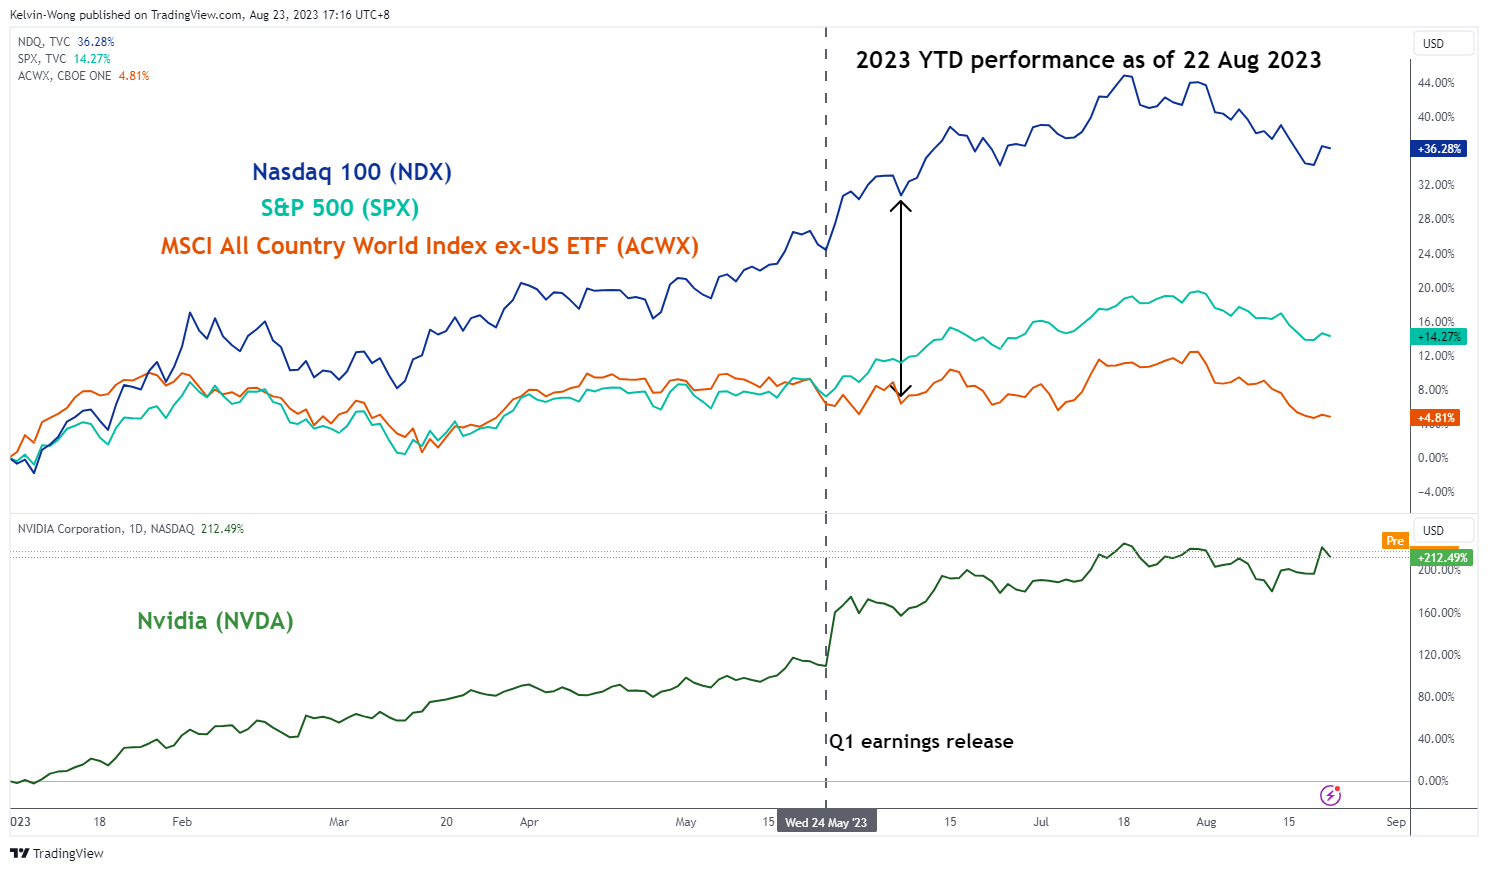
Fig 1: 2023 year-to-date performance of Nasdaq 100, S&P 500, Nvidia & MSCI All Country World Index ex-US ETF as of 22 Aug 2023
(Source: TradingView, click to enlarge chart)
Therefore, the ex-post share price performance of Nvidia when it announces its fiscal Q2 earnings later today, 23 August after the close of the US session is likely again to play a key determinant in the performance of the leading Nasdaq 100 in the remaining months of 2023 which will likely have a spill-over effect throughout the global equities space as well.
So far, analysts on the aggregate have placed lofty expectations on Nvidia’s Q2 earnings where consensus for its Q2 earnings per share is set at $2.08, which translates to a whopping +308% year-on-year increase over the same period in 2022. Also, the relative valuation of Nvidia has expanded on the high side where its forward price-to-earnings ratio stands at 44 times versus 17.6 times seen in the S&P 500.
Based on the current pricing of such future accelerated earnings growth, Nvidia now faces a higher bar of overcoming such highly optimistic expectations than before during the prior May 2023 earnings release. Hence, any minuscule disappointment in Q2 earnings numbers and or outlook trend is likely to trigger a significant negative feedback loop in the share price of Nvidia that may jeopardize the current bullish trend of the Nasdaq 100.
Bearish technical elements have emerged in Nvidia
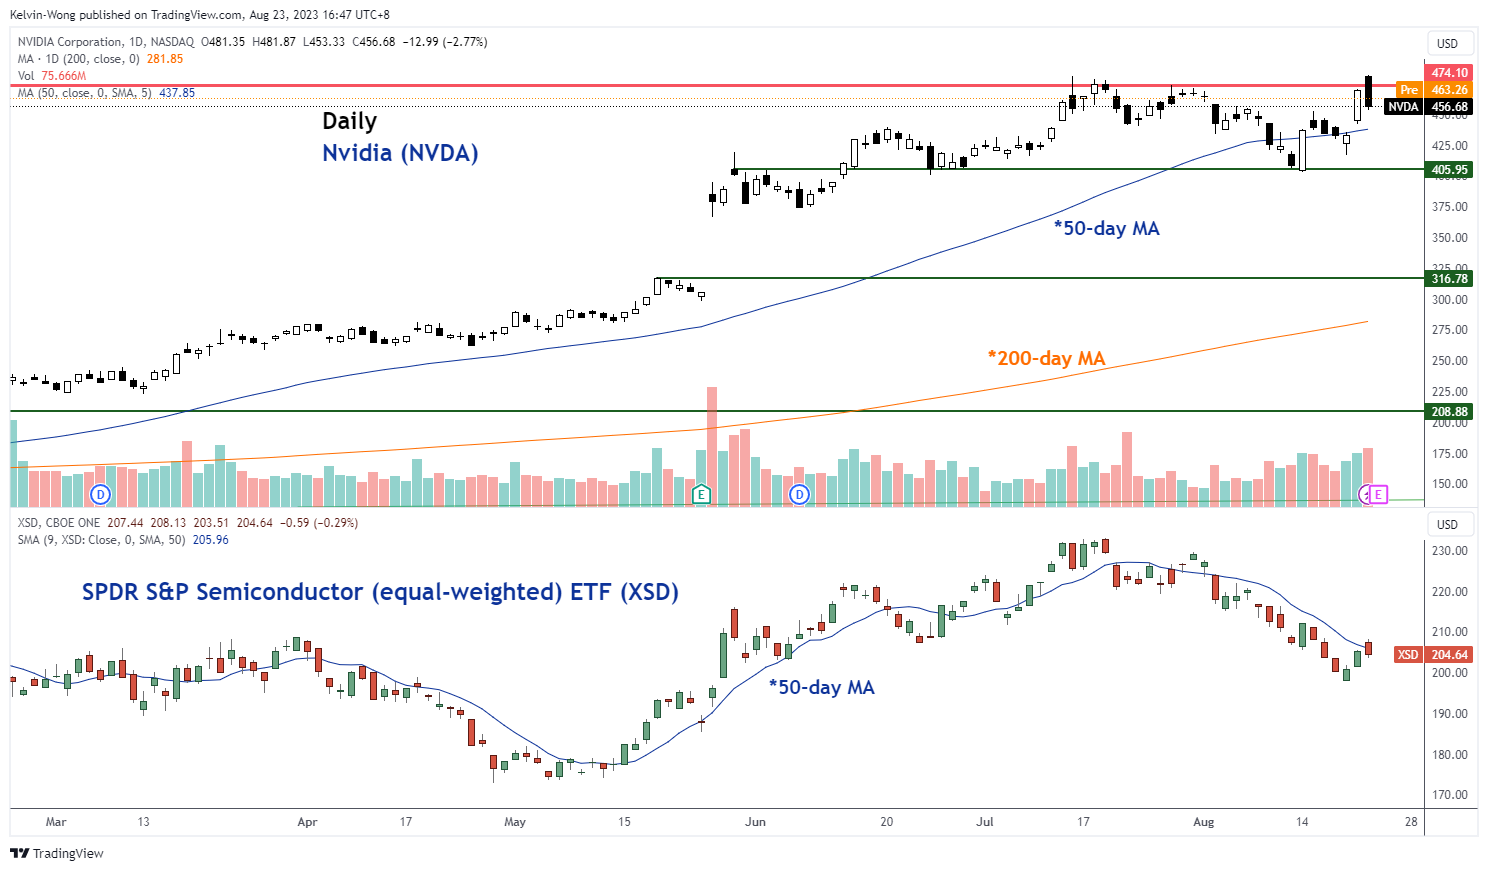
Fig 2: Medium-term trend of Nvidia & SPDR S&P Semiconductor ETF as of 22 Aug 2023 (Source: TradingView, click to enlarge chart)
In the lens of technical analysis, the current price actions of Nvidia (NVDA) have flashed out bullish exhaustion conditions which indicate an increased risk of a multi-week bearish reversal. Yesterday, 22 August, NVDA surged to print an intraday fresh all-time high of 481.87 but failed to maintain its bullish momentum. It closed lower at 456.68 below its key resistance of 474.10, and formed a daily bearish “Dark Cloud Cover” candlestick pattern with the highest volume reading since 21 July 2023.
Key medium-term support to watch will be at 405.95, a clear break with a daily close below it exposes the gap support region of 316.80 that has been formed ex-post Q1 earnings release on 24 May.
Also, the broader US semiconductor sector represented by the SPDR S&P Semiconductor equal-weighted exchange-traded fund (XSD) has continued to underperform against NVDA since 2 August 2023 as its price actions remained below its downward sloping 50-day moving average.
Content is for general information purposes only. It is not investment advice or a solution to buy or sell securities. Opinions are the authors; not necessarily that of OANDA Business Information & Services, Inc. or any of its affiliates, subsidiaries, officers or directors. If you would like to reproduce or redistribute any of the content found on MarketPulse, an award winning forex, commodities and global indices analysis and news site service produced by OANDA Business Information & Services, Inc., please access the RSS feed or contact us at [email protected]. Visit https://www.marketpulse.com/ to find out more about the beat of the global markets. © 2023 OANDA Business Information & Services Inc.
Latest posts by Kelvin Wong (see all)
- SEO Powered Content & PR Distribution. Get Amplified Today.
- PlatoData.Network Vertical Generative Ai. Empower Yourself. Access Here.
- PlatoAiStream. Web3 Intelligence. Knowledge Amplified. Access Here.
- PlatoESG. Automotive / EVs, Carbon, CleanTech, Energy, Environment, Solar, Waste Management. Access Here.
- PlatoHealth. Biotech and Clinical Trials Intelligence. Access Here.
- ChartPrime. Elevate your Trading Game with ChartPrime. Access Here.
- BlockOffsets. Modernizing Environmental Offset Ownership. Access Here.
- Source: https://www.marketpulse.com/indices/d-day-for-the-us-stock-market-as-nvidia-earnings-loom/kwong

