
Published 3 hours ago
Bitcoin Price Prediction: Over the past three weeks, the Bitcoin price has been moving sideways to take a temporary break from the prevailing uptrend. Moreover, this consolidation has been strictly resonating between two converging trendlines indicating the formation of the symmetrical triangle pattern. In theory, this pattern is a continuation pattern that encourages the resumption of prior recovery upon the breakout of its overhead trendline. Here’s how you may trade this chart pattern.
advertisement
Key Points:
- The Bitcoin price moving within the triangle can be considered a no-trading zone
- A breakdown from either trendline of the triangle pattern will determine the future trend
- The intraday trading volume in Bitcoin is $16.2 Billion, indicating an 18.5% gain.
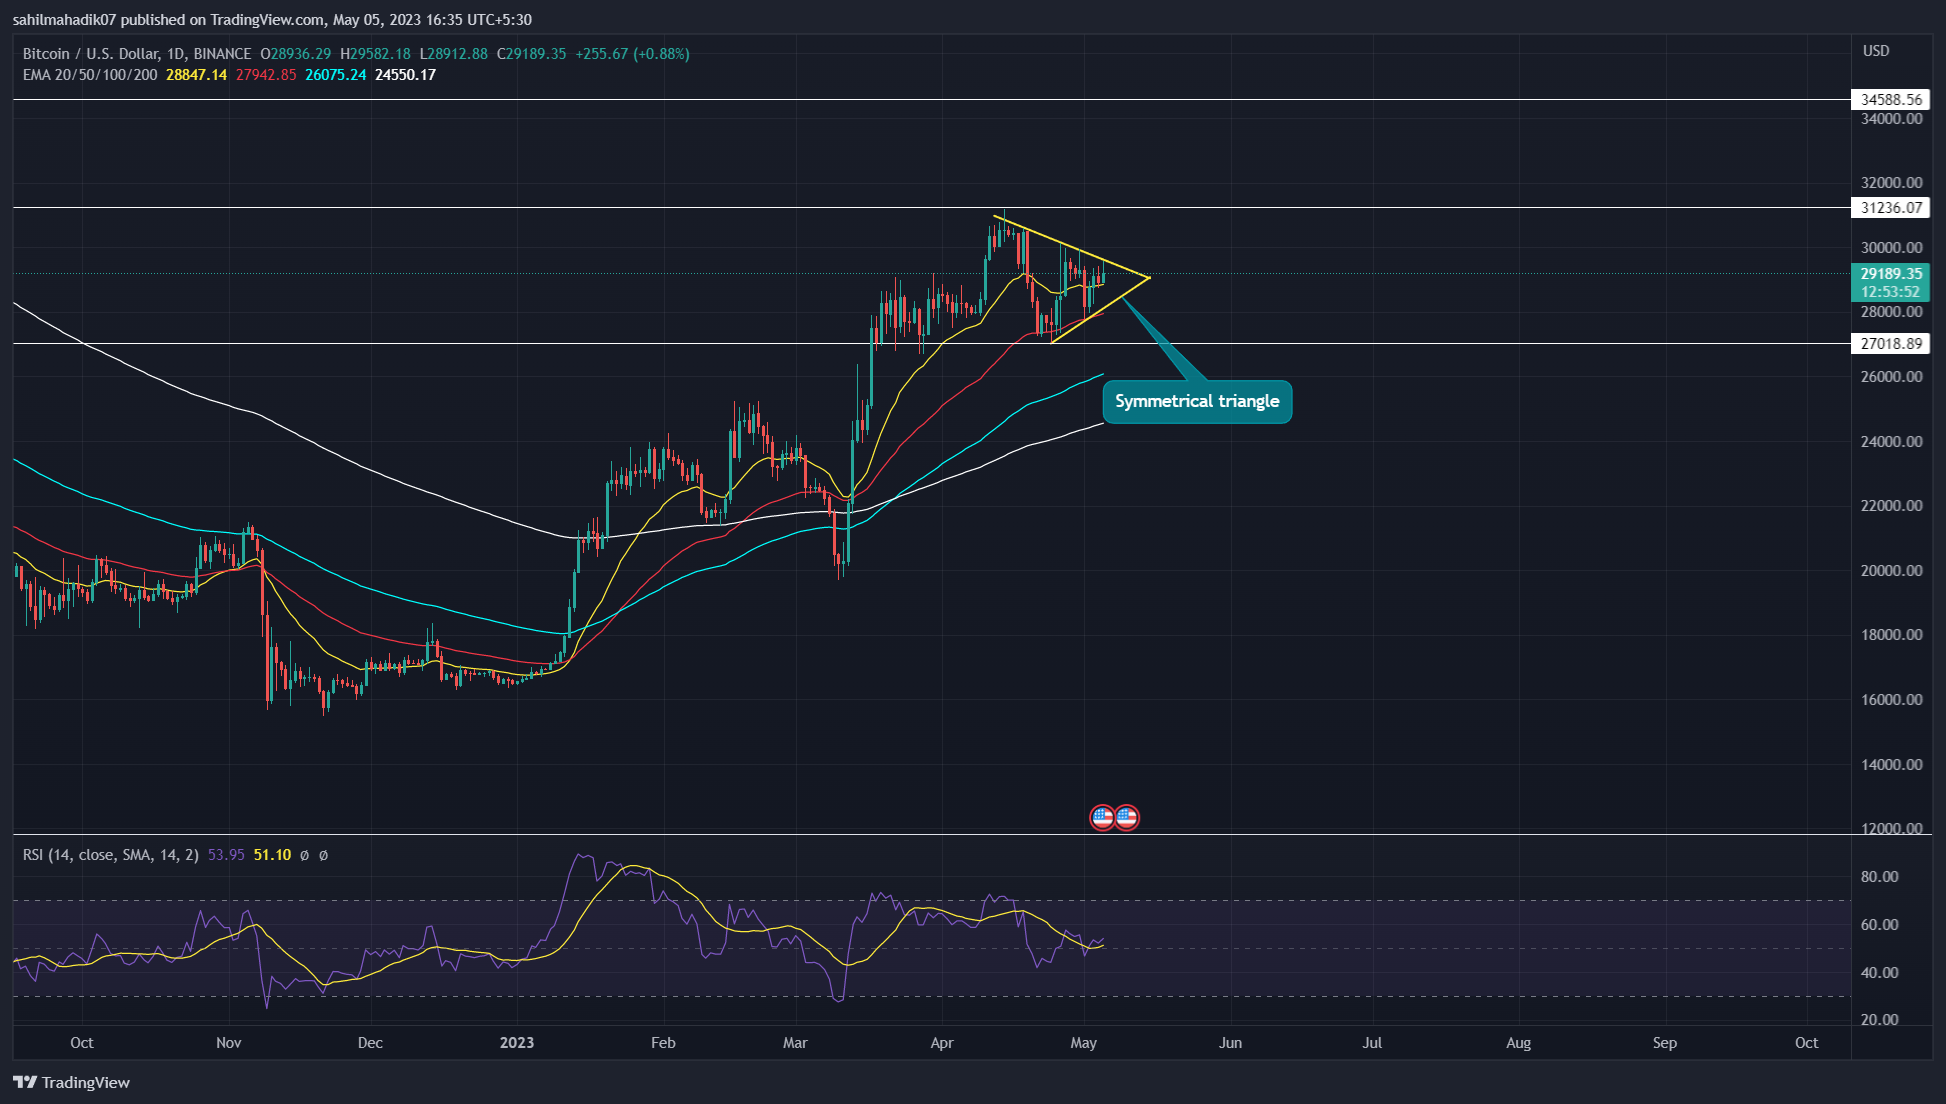
Source-Tradingview
Today, the Bitcoin price trades at the $29180 mark with an intraday gain of 0.85%. However, the daily candle shows a higher price rejection at the pattern’s resistance trendline indicating that the sellers continue to defend this level.
This rejection candle increases the chances of price reversal which may tumble the prices by barely 2% and hit the lower trendline. Therefore, the Bitcoin price may continue the sideways trend until this pattern is intact.
Trending Stories
Anyhow, the symmetrical triangle encourages the resumption of the prior trend, which therefore will bolster buyers to break the overhead trendline. A daily candle closing above the trendline will offer an entry opportunity and offers buyers a flipped support to raise the prices higher.
The post-breakout rally may surge the prices 8% higher to challenge the last swing high of $31170.
While things look bullish for Bitcoin price, a breakdown below the triangle’s support will invalidate the bullish thesis and trigger a longer correction.
Technical Indicator
Exponential Moving Average: The 50-day EMA acts as dynamic support and assists buyers to maintain a bullish trend during occasional pullbacks.
Relative Strength Index: The RSI slope wavering around the midline reflects market uncertainty and the need for a triangle breakout to trigger a direction rally.
Bitcoin Price Intraday Levels
- Spot rate: $29181
- Trend: Bullish
- Volatility: High
- Resistance levels- $31200 and $34600
- Support levels- $27000 and $25000
Share this article on:
advertisement
The presented content may include the personal opinion of the author and is subject to market condition. Do your market research before investing in cryptocurrencies. The author or the publication does not hold any responsibility for your personal financial loss.
<!– Close Story–>
- SEO Powered Content & PR Distribution. Get Amplified Today.
- PlatoAiStream. Web3 Data Intelligence. Knowledge Amplified. Access Here.
- Minting the Future w Adryenn Ashley. Access Here.
- Buy and Sell Shares in PRE-IPO Companies with PREIPO®. Access Here.
- Source: https://coingape.com/markets/bitcoin-price-prediction-btc-price-coiling-up-for-8-rise-in-near-future-buy-today/

