SNEAK PEEK
- Bitcoin’s aSORP (90d) signals a future bull market with a supply drop.
- Stochastic RSI suggests BTC market may be overbought.
- Bull Bear Power value shows bulls in charge and optimism for a prolonged bullish trend.
As the average lifetime of a spent output grows, Bitcoin’s aSORP (90d) signals a future bull market. This action shows that investors are keeping their Bitcoins for more extended periods, which might result in a drop in supply and a rise in demand, eventually pushing up the price of Bitcoin.
Another #Bitcoin indicator hints at explosive growth!
Historically, aSORP (90d) below 1 signals a bear market, & above 1 signals a bull market. In 2015, 2019 & 2020, it led to 6,110%, 150%, & 579% gains.
aSORP recently moved above 1, suggesting $BTC readies to go parabolic 🚀 pic.twitter.com/gSYubuvgu1
— Ali (@ali_charts) April 9, 2023
As aSORP (90d) increases over 1, it suggests that more bitcoins are being held for longer than 90 days, which might lead to market scarcity and push up the price of bitcoin even more. Bulls have continued to rule the BTC market in the previous 24 hours, with prices bouncing between support and resistance levels of $30,160.59 and $30,848.46, respectively. At the time of writing, the price was $30,836.65, an increase of 1.99%.
Market capitalization and 24-hour trading volume increased, reaching $596,092,253,410 and $20,988,753,581, respectively, by 1.94% and 6.55%. The cryptocurrency market is growing positively, and investors are becoming more interested in and confident in digital assets.
On the price chart for the BTC market, the stochastic RSI has a value of 85.21 and is above its signal line at 61.62. This move suggests that the BTC market may be overbought. Traders may consider taking profits or holding off on opening new long positions until a confirmed trend reversal has occurred.
The Bollinger bands are distended on the 4-hour price chart of the BTC market, with readings of 30928.24 and 29786.61, respectively. This motion suggests a potential breakout in either direction, and traders are watching the price movement closely for signs of a trend reversal or continuation. The difference of 1141.63 between the upper and lower bands indicates that the market is enduring high volatility and that there may be an excellent opportunity for traders to enter or exit positions.

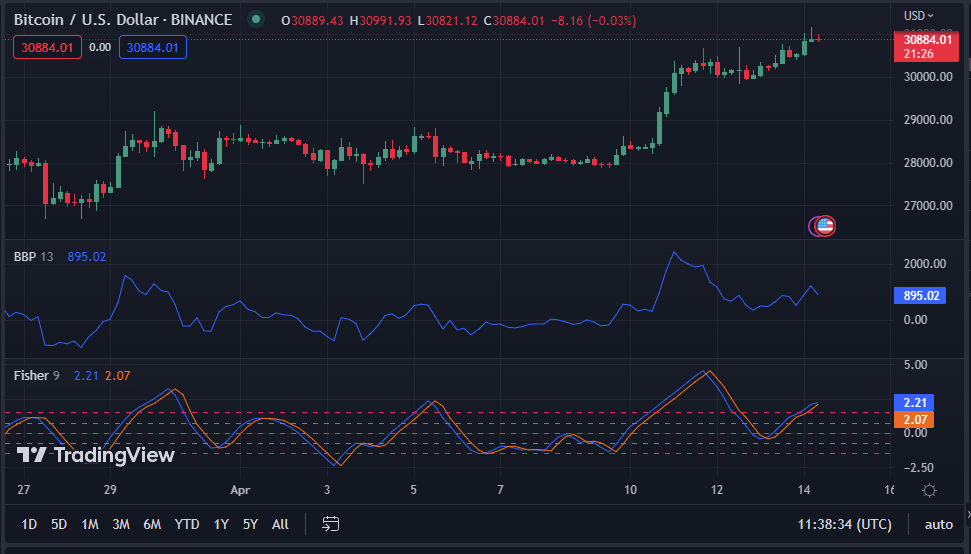
Having its line facing north, the Bull Bear Power (BBP) value of 889.62 is positive. This move shows that the bulls are in charge of the market now and that there is a greater chance that prices will rise soon. There is more optimism for a prolonged bullish hegemony due to the Bull Bear power’s upward trend.
On the 4-hour price chart, the Fisher Transform, which has a value of 2.21, has a line that crosses the signal line. Traders may consider purchasing BTC now as this action suggests a potential bullish trend reversal. With the proper risk management techniques, traders may consider taking a long position.
Bitcoin has entered a bull market as the SORP (90d) rises above 1, prompting optimism for a longer-term bullish trend. Now may be a great time to open long positions and capitalize on market conditions.
Disclaimer: Cryptocurrency price is highly speculative and volatile and should not be considered financial advice. Past and current performance is not indicative of future results. Always research and consult with a financial advisor before making investment decisions.
- SEO Powered Content & PR Distribution. Get Amplified Today.
- Platoblockchain. Web3 Metaverse Intelligence. Knowledge Amplified. Access Here.
- Source: https://investorbites.com/bitcoin-price-analysis-14-04/

