- Yesterday’s significant US dollar up moves against the EUR, GBP, and CHF have not spread to the Chinese yuan and antipodean currencies.
- The choice of China’s central bank, PBoC latest monetary policy easing measure via a cut on the required reserves ratio and upbeat retail sales and industrial production have led to a short-term “K-shaped performance” seen in the FX market.
- Short-term bullish momentum elements are sighted in AUD/USD and NZD/USD supported by a weakening USD/CNH.
Despite the European Central Bank (ECB) hike of 25 basis points to bring its policy deposit rate to 4%, market participants have viewed that as a dovish hike that triggered a significant rally in the US dollar against the Euro that has also spilled over to other European currencies such as the UK pound and the Swiss franc.
The EUR/USD tumbled by 85 pips to close yesterday, 14 September US session at 1.0644 and breached below the recent closing level’s swing lows of 31 May and 6 June reinforced by the latest ECB’s economic forecast on the Eurozone which has painted a stagflation condition; 2024’s inflation projection is upgraded to 3.2% while GDP growth is being trimmed downwards to 1% for 2024.
Not all currencies are sucked into a USD’s bullish vacuum
Interestingly, the antipodean currencies (AUD and NZD), CAD, and JPY did not manage to get ramped down by the US dollar’s bulls inflicted on the European currencies. It is likely the resilient Chinese yuan is playing either a direct or indirect role in the short-term “K-shaped” performance seen in the FX market (see chart of figure 1).
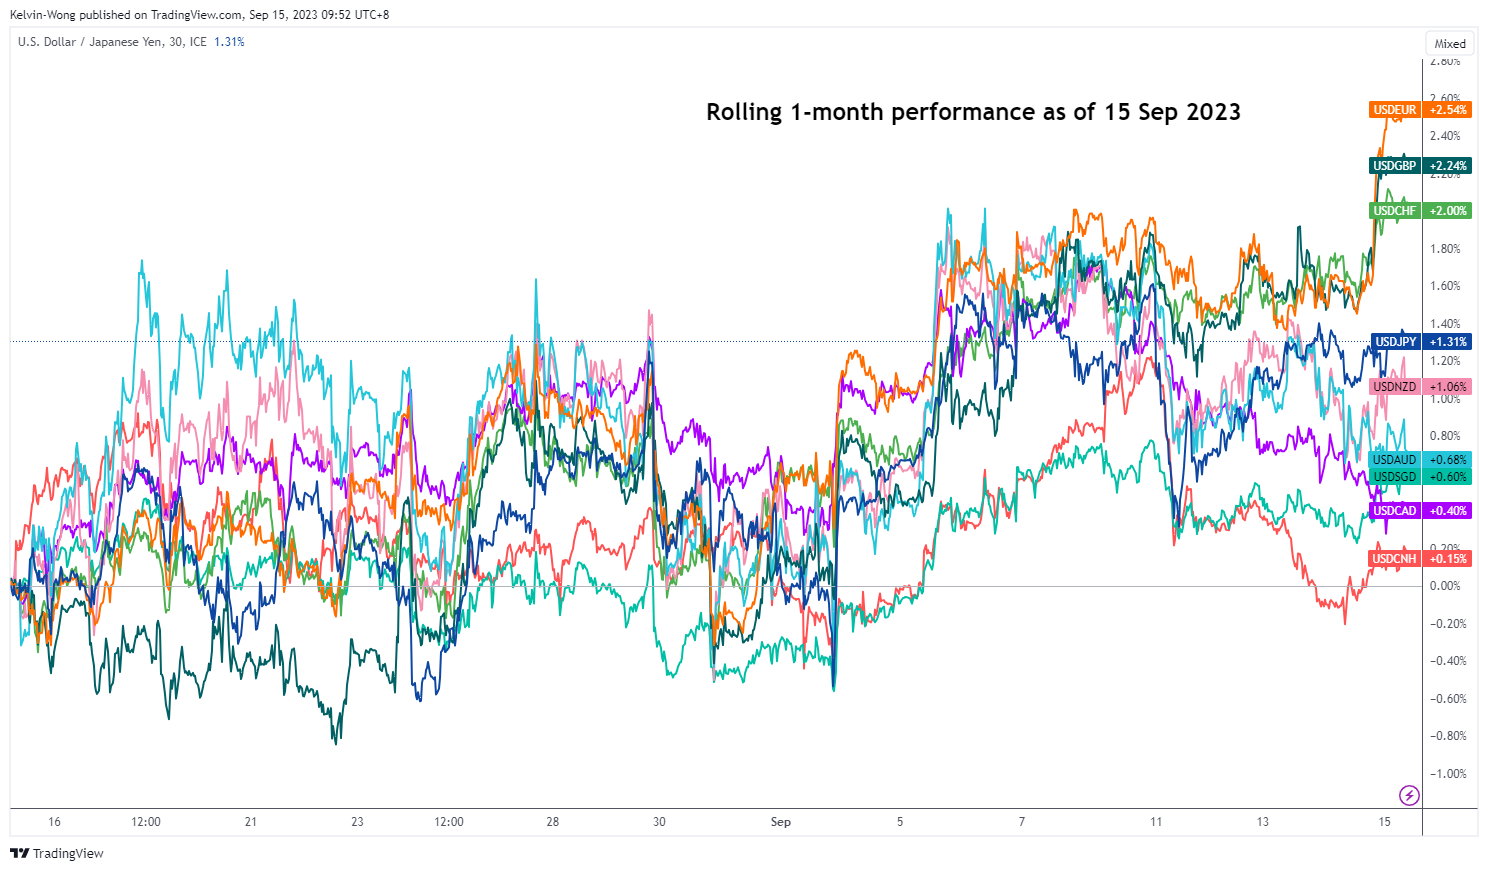
Fig 1: Rolling 1-month performance of the US dollar against the major currencies, AUD, NZD, CNH & SGD as of 15 Sep 2023 (Source: TradingView, click to enlarge chart)
China’s central bank PBoC’s latest monetary policy stimulus manoeuvre does not involve a direct cut on the 1-year medium-term lending facility rate, a key policy interest rate but rather a reduction on China’s commercial banks’ reserve requirement ratio by 25 basis points, a second reduction on the ratio so far this year.
USD/CNH major uptrend’s momentum has started to ease
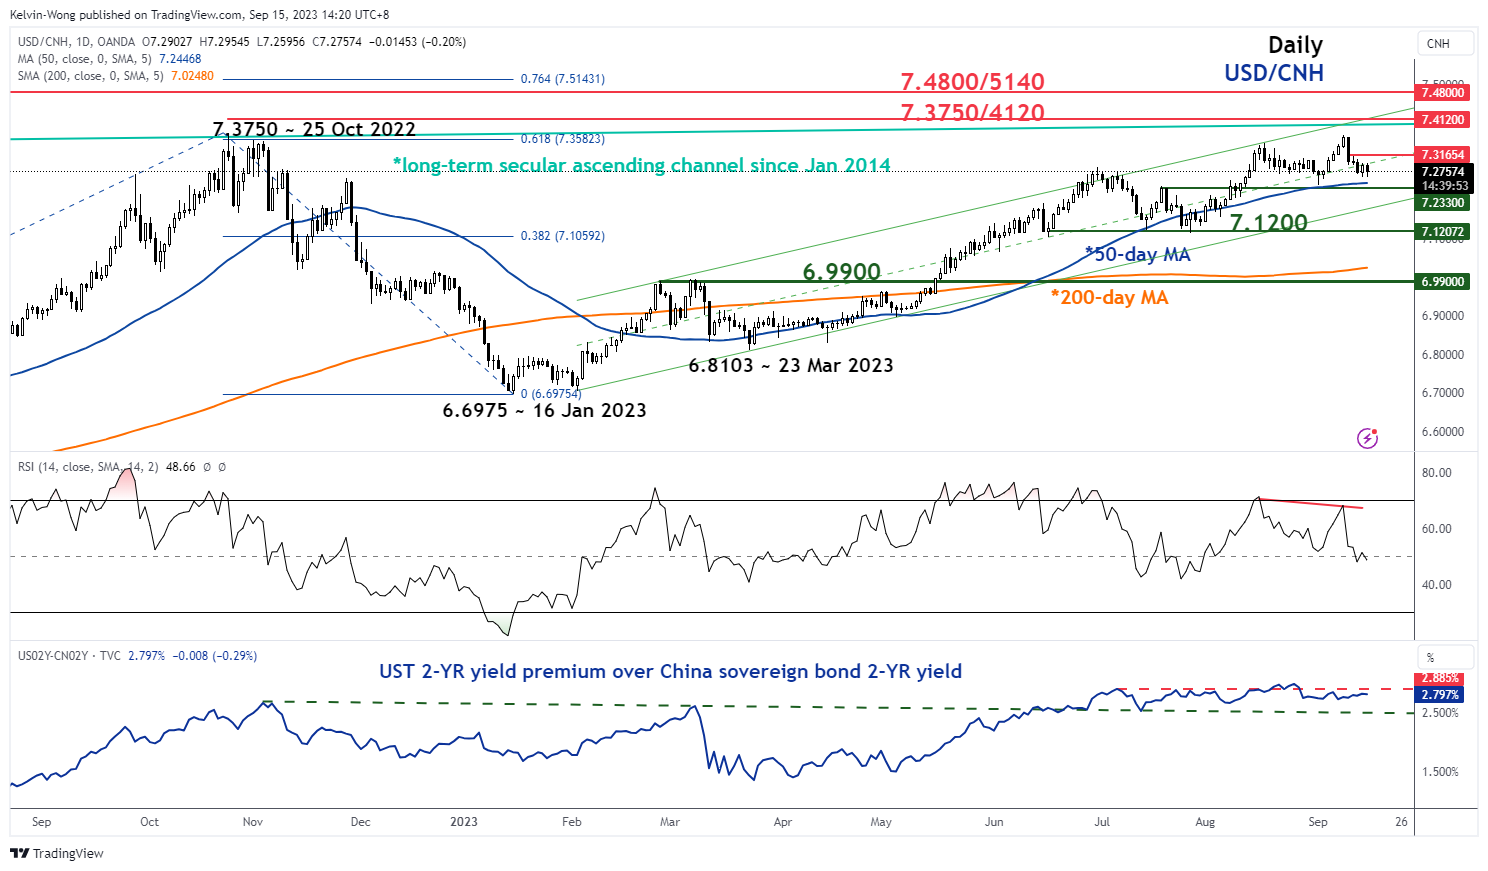
Fig 2: USD/CNH major & medium-term trends as of 15 Sep 2023 (Source: TradingView, click to enlarge chart)
Thus, by leaving interest rates unchanged in China, the upward pressure on the shorter-term US Treasuries yield premium over China’s sovereign notes is likely to be negated which in turn may choke off potential near-term US dollar strength against the offshore yuan that lead to a bullish tapering of the current major uptrend phase of the USD/CNH in place since 16 January 2023 low to allow the pair to consolidate between 7.3165 and 7.2330 (also the 50-day moving average) in the short-term.
Also, fundamental factors are also supporting today’s minor yuan strength against the US dollar. China’s retail sales for August have come in at 4.6% y/y, above the consensus of 3%, and surpassed July’s 2.5% y/y, its strongest pace of growth since May.
August’s industrial production in China also managed to beat expectations of 3.9% with a growth of 4.5% y/y, its highest reading since April.
All in All, this latest set of key economic data suggests that the risk of a deflationary spiral in China has abated by another notch.
How does it impact the Aussie and the Kiwi?
From a momentum and technical analysis standpoint, the AUD and NZD have a rather high direct correlation with the CNH (offshore yuan), and from a fundamental aspect, Australia’s commodities producers/trading firms are dependent either directly or indirectly on the fortunes of China’s economy.
Hence, a slowdown in the bullish trend of the USD/CNH is likely to lead to some form of bullish momentum to ignite the AUD/USD and NZD/USD. Let’s look at their respective short-term technical charts.
AUD/USD is forming a potential minor bullish double-bottom base
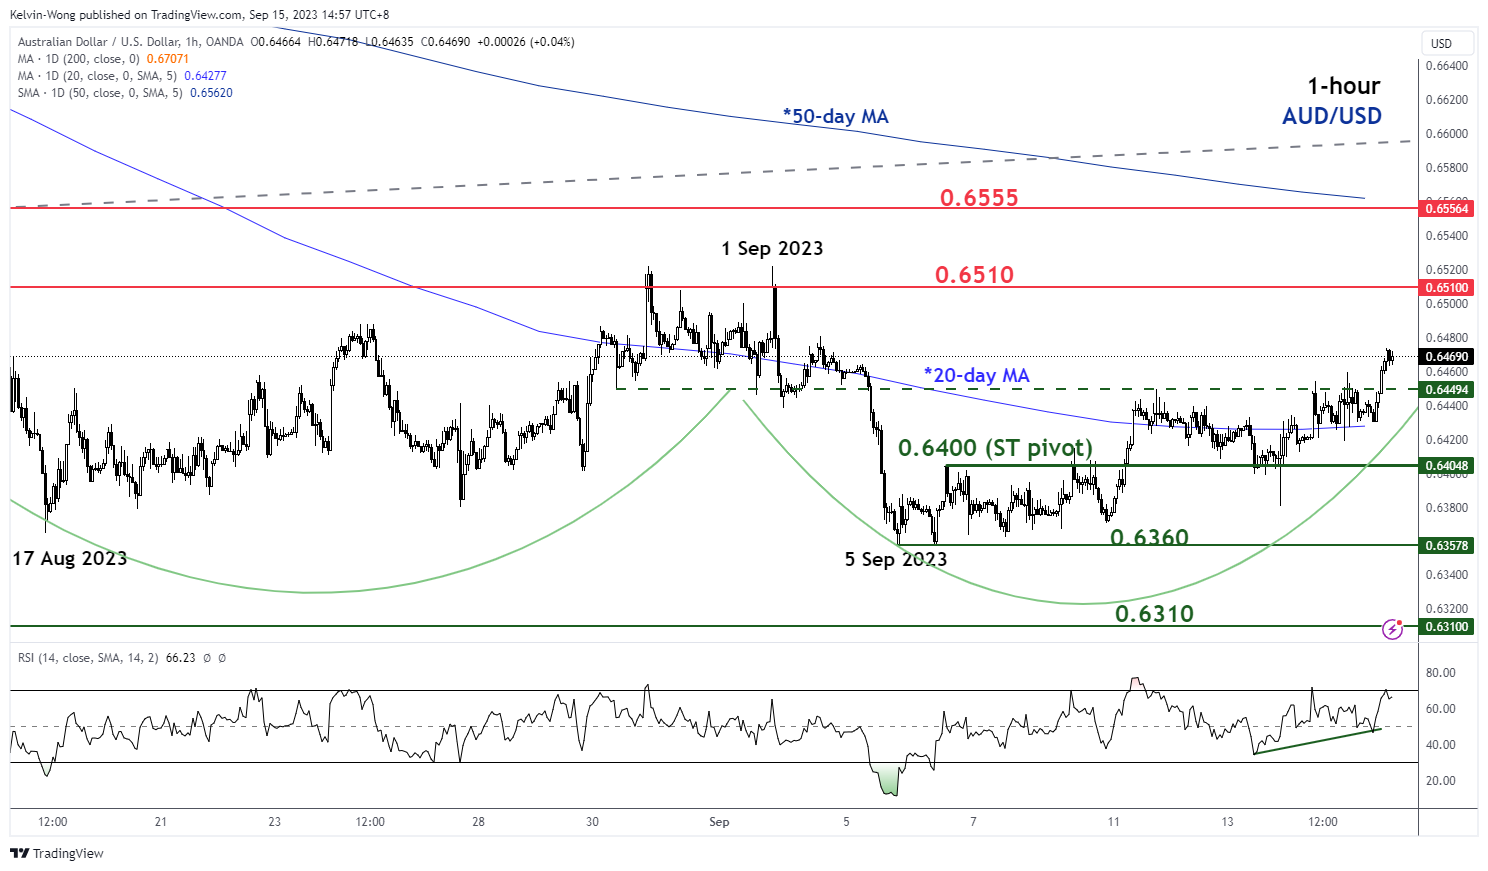
Fig 3: AUD/USD minor short-term trend as of 15 Sep 2023 (Source: TradingView, click to enlarge chart)
As seen on the 1-hour chart, the price actions of the AUD/USD have failed to have a clean break below the 17 August 2023 low of 0.6365 in the past two weeks since the start of September.
Today’s price action has tested and rebounded significantly from the 20-day moving average which suggests an emergence of bullish momentum at least in the short term. If the 0.6400 key short-term pivotal support is not broken down, the AUD/USD may see a further potential push-up towards the intermediate resistance at 0.6510 (the neckline of the minor double bottom base). Above 0.6510 sees the next resistance at 0.6555 (the 50-day moving average).
On the flip side, failure to hold at 0.6400 negates the bullish tone for a slide back toward the minor base support at 0.6360.
NZD/USD’s recent minor drop is supported by an ascending trendline
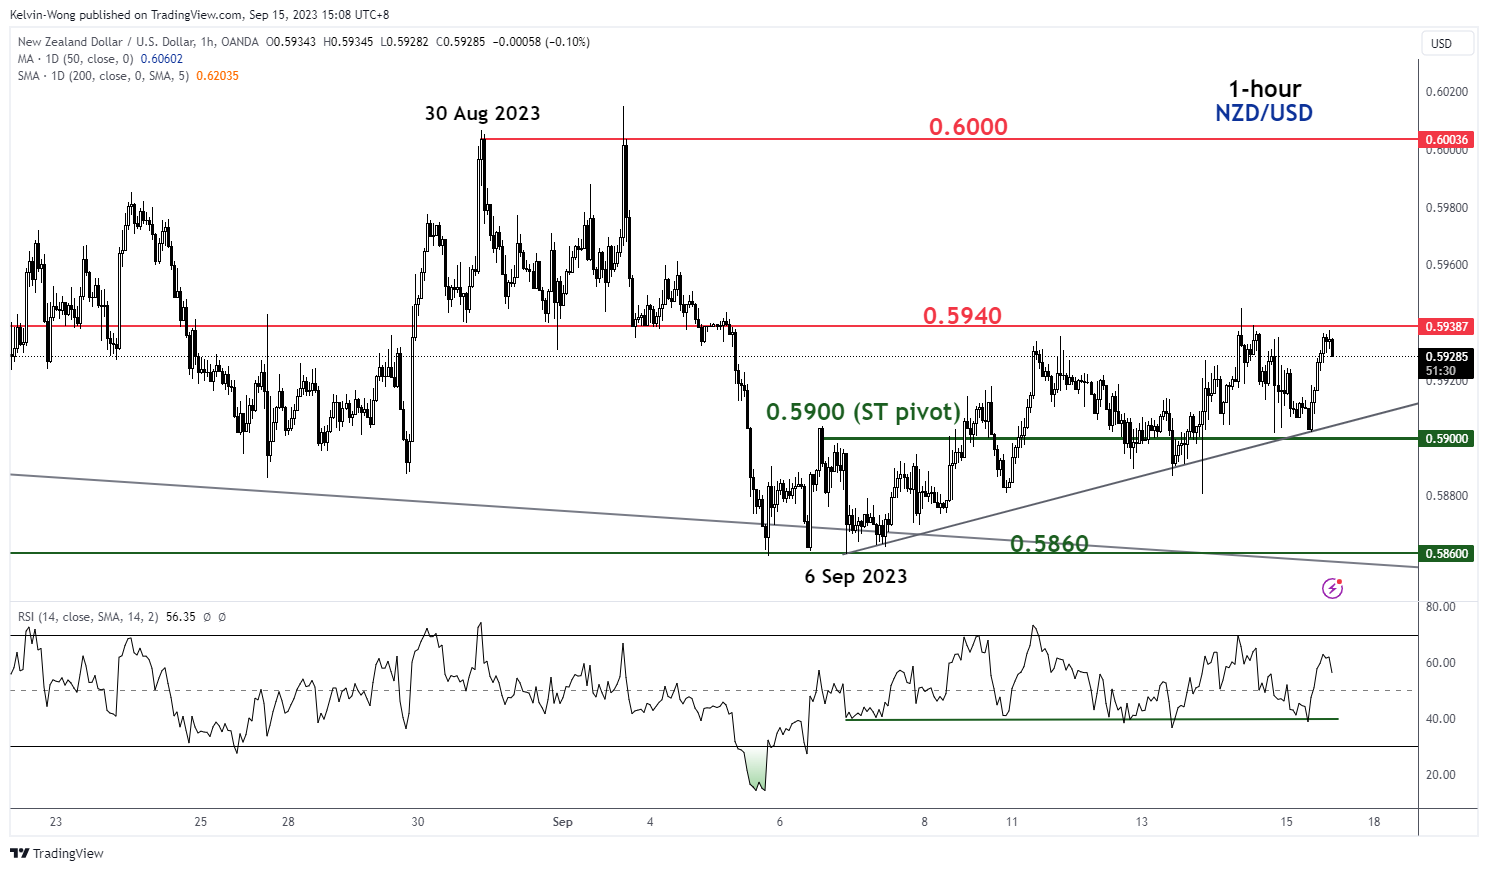
Fig 4: NZD/USD minor short-term trend as of 15 Sep 2023 (Source: TradingView, click to enlarge chart)
The technical elements seen in the NZD/USD are not as bullish as the AUD/USD but since its 6 September 2023 low, the price actions have traced out a series of “higher lows” and an ascending trendline is now acting as a support at around 0.5900.
Watch the 0.5900 key short-term pivotal support and a clearance above 0.5940 intermediate resistance may trigger a more pronounced bullish momentum towards the next resistance at 0.6000.
However, a break below 0.5900 may see another round of choppy movement to retest the 6 September 2023 swing low of 0.5860.
Benchmark Hong Kong stock indices are looking to end on positive weekly closing levels
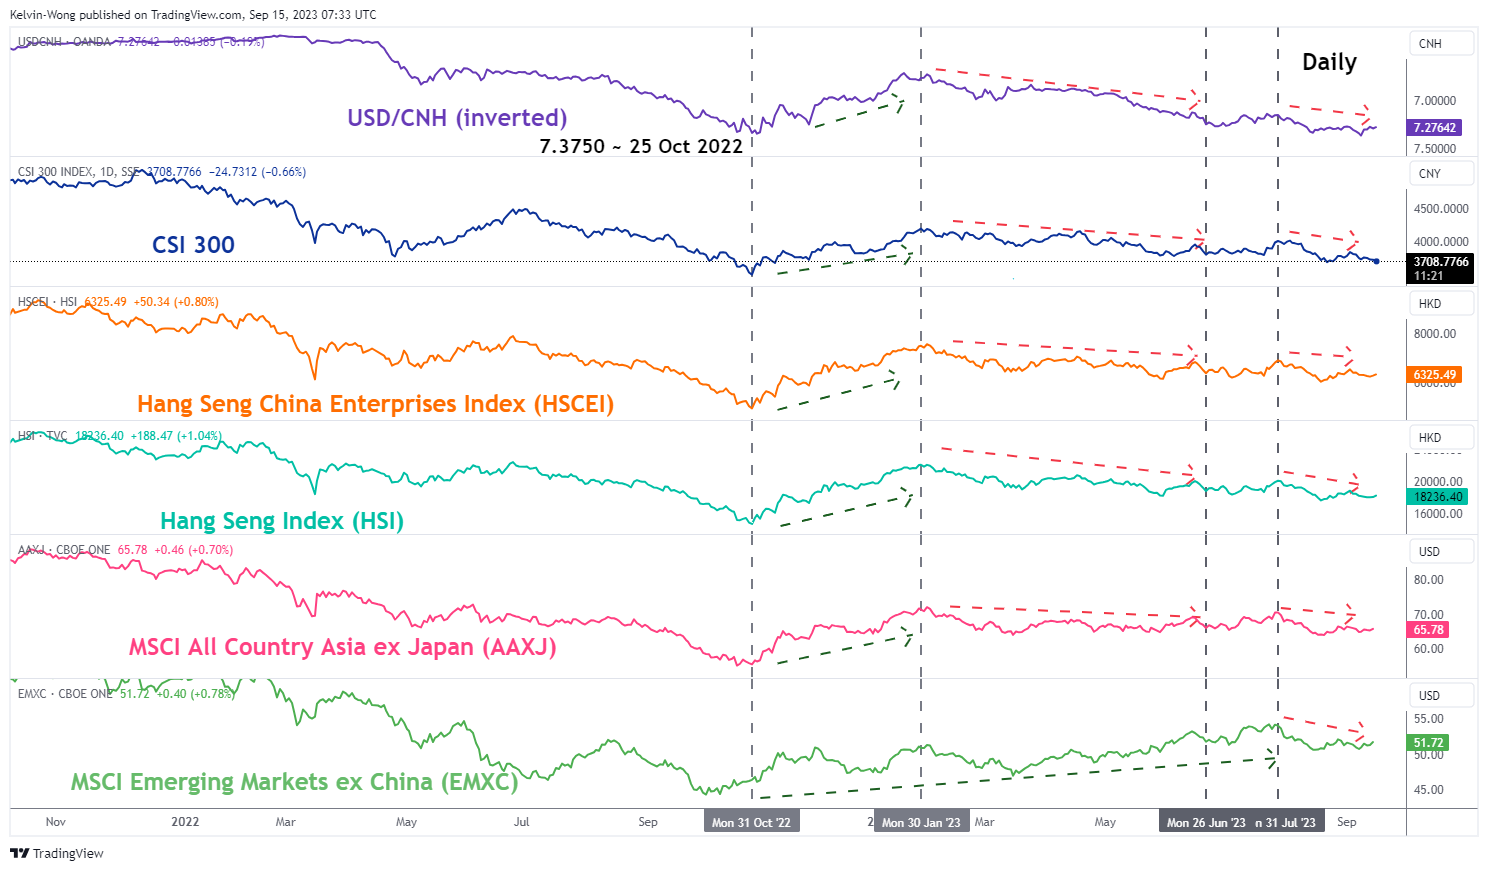
Fig 5: USD/CNH’s correlation with Hang Seng indices as of 15 Sep 2023 (Source: TradingView, click to enlarge chart)
Since late October 2022, the Heng Seng Index (HSI) and the Hang Seng China Enterprise Index (HSCEI) have moved in lockstep with the USD/CNH (offshore yuan) where a significant yuan weakness against the USD tends to see a similar bearish sentiment towards HSI and HSCEI.
Since the bullish momentum of USD/CNH has started to abate which in turn has led the HSI and HSCEI to erase their earlier losses at the start of this week and recorded intra-session weekly gains of +0.20% for both indices at this time of the writing.
Content is for general information purposes only. It is not investment advice or a solution to buy or sell securities. Opinions are the authors; not necessarily that of OANDA Business Information & Services, Inc. or any of its affiliates, subsidiaries, officers or directors. If you would like to reproduce or redistribute any of the content found on MarketPulse, an award winning forex, commodities and global indices analysis and news site service produced by OANDA Business Information & Services, Inc., please access the RSS feed or contact us at [email protected]. Visit https://www.marketpulse.com/ to find out more about the beat of the global markets. © 2023 OANDA Business Information & Services Inc.
Latest posts by Kelvin Wong (see all)
- SEO Powered Content & PR Distribution. Get Amplified Today.
- PlatoData.Network Vertical Generative Ai. Empower Yourself. Access Here.
- PlatoAiStream. Web3 Intelligence. Knowledge Amplified. Access Here.
- PlatoESG. Automotive / EVs, Carbon, CleanTech, Energy, Environment, Solar, Waste Management. Access Here.
- PlatoHealth. Biotech and Clinical Trials Intelligence. Access Here.
- ChartPrime. Elevate your Trading Game with ChartPrime. Access Here.
- BlockOffsets. Modernizing Environmental Offset Ownership. Access Here.
- Source: https://www.marketpulse.com/forex/a-resilient-chinese-yuan-is-supporting-hong-kong-equities-and-antipodean-currencies/kwong

