XRP price started a downside correction from the $0.6700 resistance. The bulls are now active above $0.5400 and might aim for a fresh increase.
- XRP started a fresh increase above the $0.600 resistance level.
- The price is now trading above $0.550 and the 100 simple moving average (4 hours).
- There was a break below a key rising channel with support at $0.610 on the 4-hour chart of the XRP/USD pair (data source from Kraken).
- The pair could start a fresh rally if there is a close above the $0.60 resistance zone.
XRP Price Revisits Support
In the past few days, XRP price climbed higher from the $0.550 zone. There was a move above the $0.580 and $0.600 resistance levels. However, the upside was less compared to Bitcoin and Ethereum.
The price even climbed above the $0.650 resistance before the bears appeared. A new multi-week high was formed near $0.6692 before the price dived. There was a strong bearish wave below the $0.620 support. There was a break below a key rising channel with support at $0.610 on the 4-hour chart of the XRP/USD pair.
The pair even dived below the $0.600 level. A low was formed near $0.530 and the price is now attempting a fresh increase. There was a move above the $0.560 level and the 23.6% Fib retracement level of the downward move from the $0.6692 swing high to the $0.530 low.
Ripple’s token price is now trading above $0.550 and the 100 simple moving average (4 hours). On the upside, immediate resistance is near the $0.600 zone or the 50% Fib retracement level of the downward move from the $0.6692 swing high to the $0.530 low.
The first key resistance is near $0.6240, above which the price could rise toward the $0.650 resistance. A close above the $0.650 resistance zone could spark a strong increase.
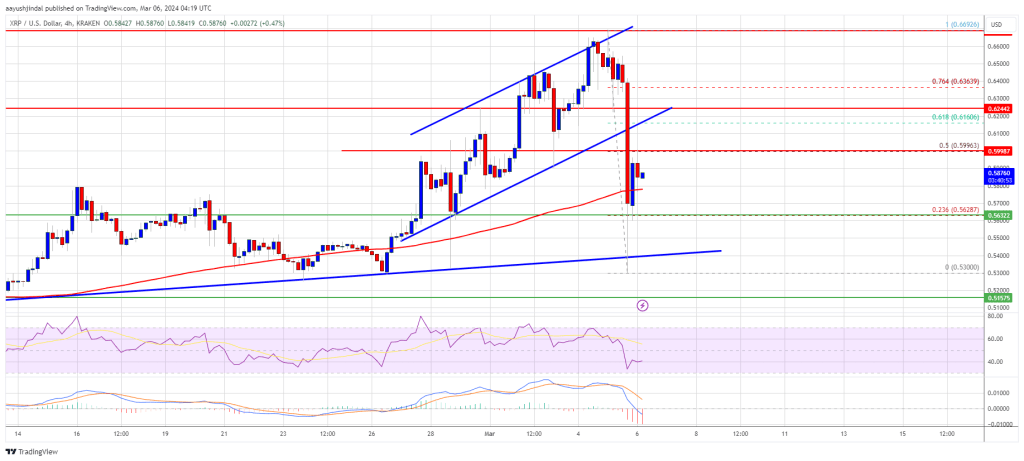
Source: XRPUSD on TradingView.com
The next key resistance is near $0.680. If the bulls remain in action above the $0.680 resistance level, there could be a rally toward the $0.7050 resistance. Any more gains might send the price toward the $0.7320 resistance.
Another Decline?
If XRP fails to clear the $0.60 resistance zone, it could start another decline. Initial support on the downside is near the $0.562 zone.
The next major support is at $0.540 and a connecting bullish trend line. If there is a downside break and a close below the $0.540 level, the price might accelerate lower. In the stated case, the price could retest the $0.5120 support zone.
Technical Indicators
4-Hours MACD – The MACD for XRP/USD is now losing pace in the bullish zone.
4-Hours RSI (Relative Strength Index) – The RSI for XRP/USD is now below the 50 level.
Major Support Levels – $0.5620, $0.540, and $0.5120.
Major Resistance Levels – $0.600, $0.6240, and $0.650.
Disclaimer: The article is provided for educational purposes only. It does not represent the opinions of NewsBTC on whether to buy, sell or hold any investments and naturally investing carries risks. You are advised to conduct your own research before making any investment decisions. Use information provided on this website entirely at your own risk.
- SEO Powered Content & PR Distribution. Get Amplified Today.
- PlatoData.Network Vertical Generative Ai. Empower Yourself. Access Here.
- PlatoAiStream. Web3 Intelligence. Knowledge Amplified. Access Here.
- PlatoESG. Carbon, CleanTech, Energy, Environment, Solar, Waste Management. Access Here.
- PlatoHealth. Biotech and Clinical Trials Intelligence. Access Here.
- Source: https://www.newsbtc.com/analysis/xrp/xrp-price-prediction-0-65/

