XRP price is correcting gains from the $0.585 resistance against the US Dollar. The bulls are active near $0.550 and might soon initiate a new rally.
- XRP started a strong increase above the $0.55 resistance.
- The price is now trading above $0.525 and the 100 simple moving average (4 hours).
- There is a key bullish trend line forming with support near $0.5520 on the 4-hour chart of the XRP/USD pair (data source from Kraken).
- The pair might correct further lower, but the bulls could remain active near $0.5320.
XRP Price Holds Ground
After forming a base above the $0.478 level, XRP started a fresh increase. The recent pump in Bitcoin and Ethereum also dragged XRP higher. The price gained pace after it broke the $0.525 resistance.
There was a move above the $0.550 and $0.565 resistance levels. Finally, it traded to a new multi-week high at $0.5859. Recently, there was a downside correction below the $0.575 level. The price declined below the 23.6% Fib retracement level of the upward move from the $0.4778 swing low to the $0.5859 high.
The price is now trading above $0.525 and the 100 simple moving average (4 hours). There is also a key bullish trend line forming with support near $0.5520 on the 4-hour chart of the XRP/USD pair.
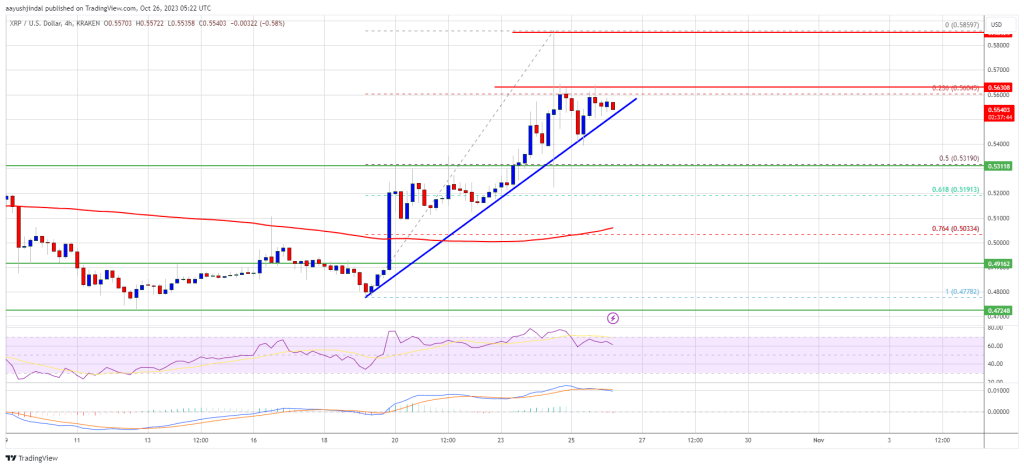
Source: XRPUSD on TradingView.com
On the upside, immediate resistance is near the $0.563 level. A close above the $0.563 level could send the price toward the $0.585 resistance. If the bulls remain in action above the $0.585 resistance level, there could be a drift toward the $0.620 resistance. Any more gains might send XRP toward the $0.645 resistance.
Are Dips Limited?
If XRP fails to clear the $0.563 resistance zone, it could continue to move down. Initial support on the downside is near the $0.5520 zone and the trend line.
The next major support is at $0.532 or the 50% Fib retracement level of the upward move from the $0.4778 swing low to the $0.5859 high. If there is a downside break and a close below the $0.532 level, The price might accelerate lower. In the stated case, the price could retest the $0.505 support zone.
Technical Indicators
4-Hours MACD – The MACD for XRP/USD is now losing pace in the bullish zone.
4-Hours RSI (Relative Strength Index) – The RSI for XRP/USD is now above the 50 level.
Major Support Levels – $0.552, $0.532, and $0.505.
Major Resistance Levels – $0.563, $0.585, and $0.620.
- SEO Powered Content & PR Distribution. Get Amplified Today.
- PlatoData.Network Vertical Generative Ai. Empower Yourself. Access Here.
- PlatoAiStream. Web3 Intelligence. Knowledge Amplified. Access Here.
- PlatoESG. Carbon, CleanTech, Energy, Environment, Solar, Waste Management. Access Here.
- PlatoHealth. Biotech and Clinical Trials Intelligence. Access Here.
- Source: https://www.newsbtc.com/analysis/xrp/xrp-price-prediction-bulls-rally-0-585/

