- XRP price started a fresh decline from the $0.600 resistance against the US dollar.
- The price is now trading below $0.585 and the 55 simple moving average (4 hours).
- There is a key declining channel forming with resistance near $0.5715 on the 4-hour chart of the XRP/USD pair (data source from Bittrex).
- The pair could extend losses if it breaks the $0.532 support zone.
XRP price is struggling below $0.600 against the US Dollar, unlike Bitcoin. The price could decline further if it settles below the $0.532 support in the near term.
XRP Price Analysis
In the past few hours, Ripple’s XRP price started a fresh decline from the $0.600 zone against the US Dollar. The XRP/USD pair stayed below the $0.592 level and extended its decline.
The bears were able to push the price below the $0.585 support. The pair broke the 23.6% Fib retracement level of the upward move from the $0.4541 swing low to the $0.5942 high. It is now trading below $0.585 and the 55 simple moving average (4 hours).
There is also a key declining channel forming with resistance near $0.5715 on the 4-hour chart of the XRP/USD pair. Initial support on the downside is near $0.532 or the 50% Fib retracement level of the upward move from the $0.4541 swing low to the $0.5942 high.
The next major support is near the $0.500 level. The main support sits at $0.475. Any more losses could lead the price toward the $0.458 level, below which the price might even test $0.420.
On the upside, the price is facing resistance near $0.572. The next major resistance is near the $0.595 level. A clear move above $0.595 might start a fresh increase. In the stated case, the price could even surpass the $0.620 resistance. Any more gains might send the price toward the $0.650 resistance.
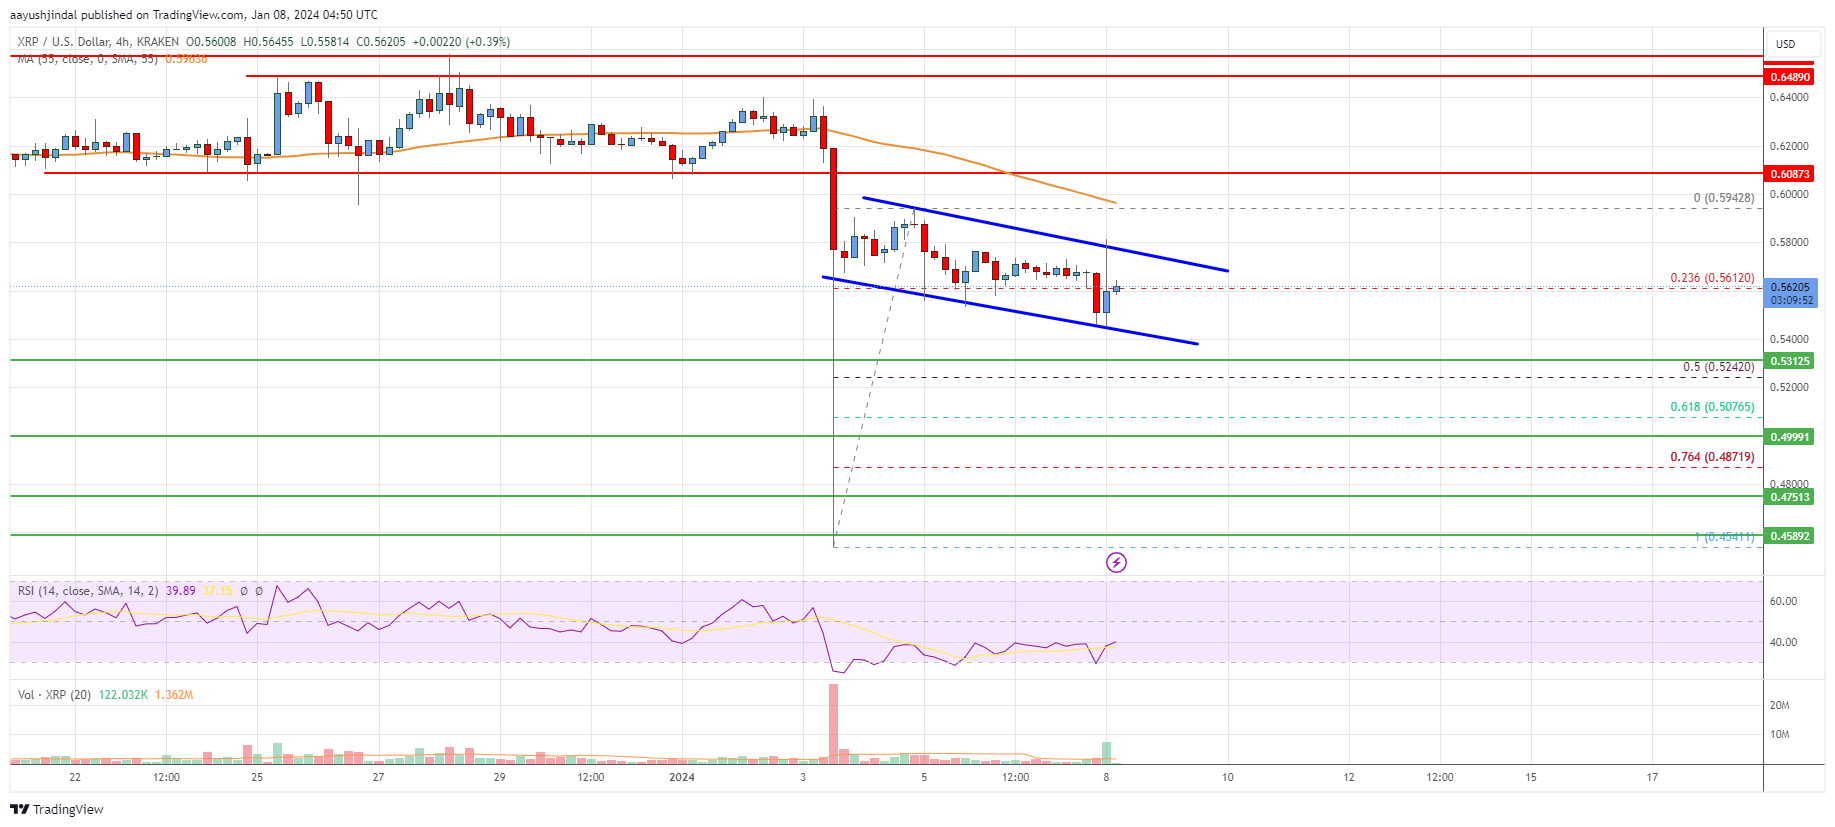
Looking at the chart, XRP price is now trading below the $0.592 zone and the 55 simple moving average (4 hours). Overall, the price could extend losses if it breaks the $0.532 support zone.
Technical indicators
4 hours MACD – The MACD for XRP/USD is now gaining momentum in the bearish zone.
4 hours RSI (Relative Strength Index) – The RSI for XRP/USD is below the 50 level.
Key Support Levels – $0.532, $0.500, and $0.475.
Key Resistance Levels – $0.572 and $0.595.
- SEO Powered Content & PR Distribution. Get Amplified Today.
- PlatoData.Network Vertical Generative Ai. Empower Yourself. Access Here.
- PlatoAiStream. Web3 Intelligence. Knowledge Amplified. Access Here.
- PlatoESG. Carbon, CleanTech, Energy, Environment, Solar, Waste Management. Access Here.
- PlatoHealth. Biotech and Clinical Trials Intelligence. Access Here.
- Source: https://www.livebitcoinnews.com/xrp-price-analysis-xrp-at-risk-of-fresh-decline/

