- Two key positive technical analysis elements have emerged at the US$67.55/66.35 major support zone.
- The current medium-term downtrend phase from September 2023 may have reached a terminal point for a potential bullish reversal.
- China’s rosy retail sales and industrial production for November managed to offset downbeat housing data that provided a short-term tailwind for oil prices.
The medium-term downtrend phase of West Texas Oil (a proxy of WTI crude oil futures) in place since the 28 September 2023 high of US$95.50/barrel has almost reached the upper limit of a major support zone of US$67.55 (printed at an intraday low of US$67.82/barrel on 13 December 2023).
In addition, two key bullish elements have emerged where the price actions of West Texas Oil have traced out an impending bullish “Descending Wedge” configuration (see Fig 1) with a bullish divergence condition seen in the daily RSI momentum indicator at its oversold region on 12 December 2023.
Medium-term downtrend phase from September 2023 may have ended
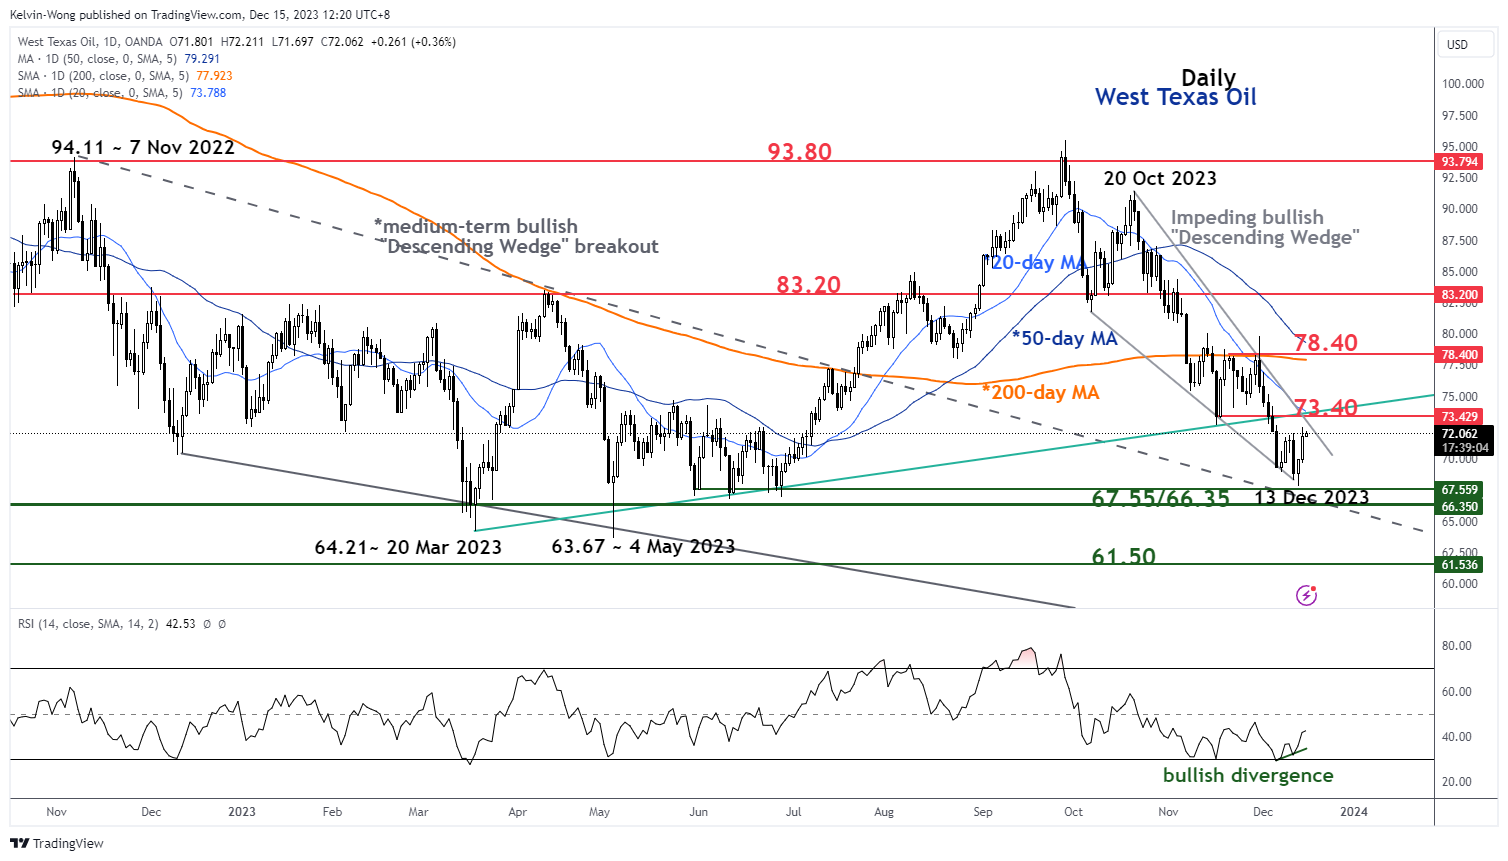
Fig 1: West Texas Oil medium-term trend as of 15 Dec 2023 (Source: TradingView, click to enlarge chart)
All in all, such medium-term bullish elements suggest that the recent medium-term downtrend that recorded an accumulated loss of -29% (28 September 2023 high to 13 December 2023 low) may have reached a terminal point (end of the medium-term downtrend) which in turn advocates the potential start of a minor short-term uptrend phase in the first step for West Texas Oil (a proxy of WTI crude oil futures).
Recent key economic data and events also supported the current +6% gain in oil prices seen in the last two days; oil prices have seen a bit of a “demand pull” factor due to the improved liquidity conditions after the US Federal Reserve’s dovish pivot on Wednesday, 13 December.
Also, a set of China’s key economic data for November released today has indicated some positive turnaround where industrial production advanced by 6% y/y, above the 4.6% y/y growth recorded in October and beat expectations of 5.6% y/y. Retail sales rose by 10.1 y/y, much faster than 7.6% y/y in October, and notched its 11th consecutive month of growth but below expectations of 12.5% y/y.
The rosy data from industrial production and retail sales have managed to offset the ongoing chronic weakness seen in the property development market as new home prices decelerated to -0.2% y/y in November from -0.1% y/y in October which marked its 5th consecutive month of decline.
Watch the short-term key support at US$70.00
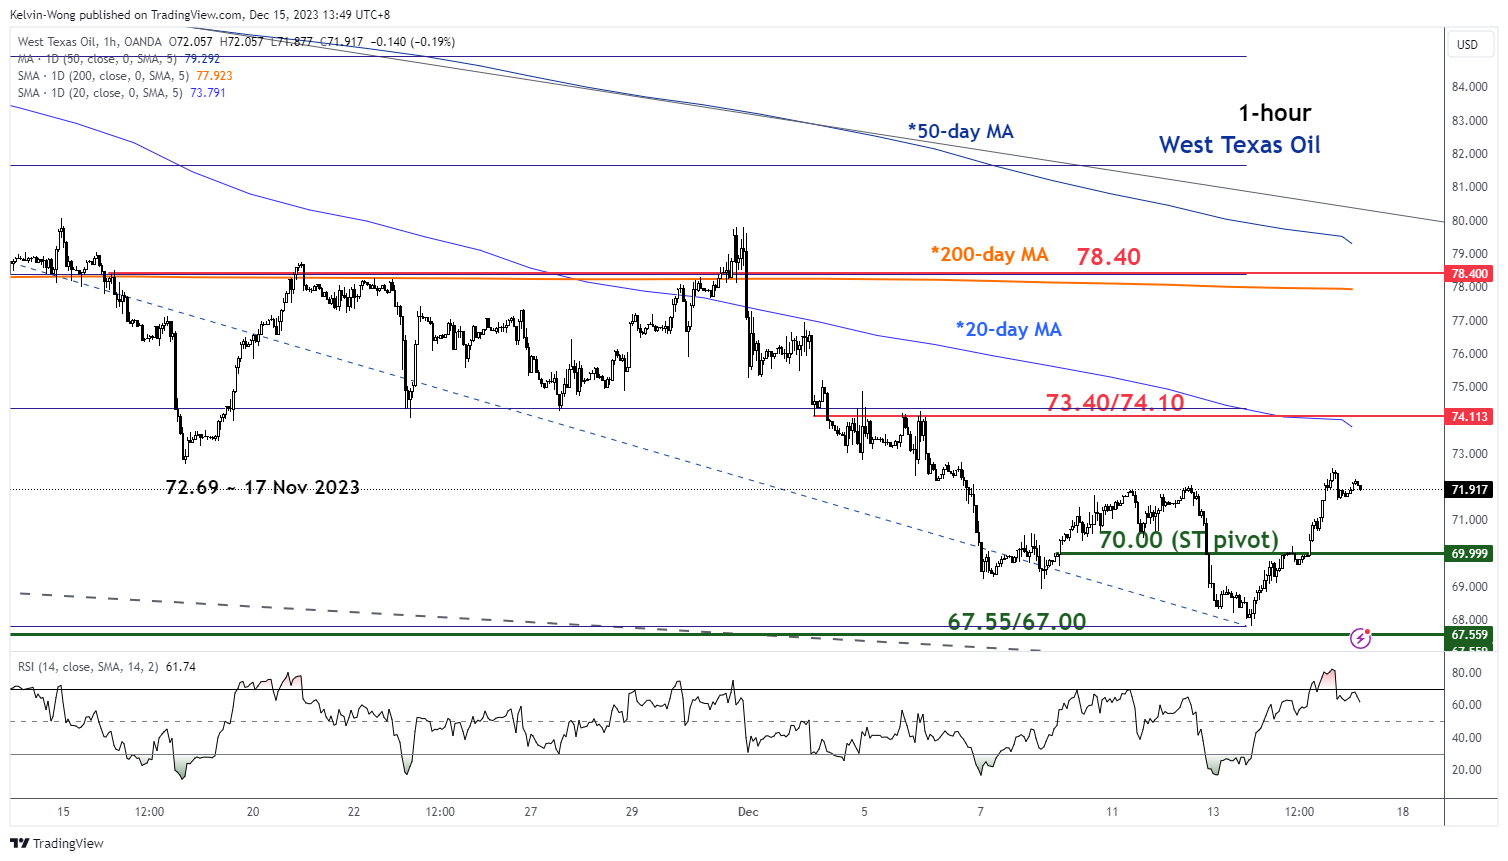
Fig 2: West Texas Oil minor short-term trend as of 15 Dec 2023 (Source: TradingView, click to enlarge chart)
In the shorter term as depicted in the hourly chart, the price actions of West Texas Oil may have evolved into a minor uptrend phase with key short-term pivotal support at US$70.00.
A clearance above the near-term resistance zone of US$73.40/74.10 (the upper limit of the “Descending Wedge” & 20-day moving average) may add further bullish impetus to see the next intermediate resistance coming in at US$78.40 (also the 200-day moving average & 38.2% Fibonacci retracement of the medium-term downtrend from 28 September 2023 high to 13 December 2023 low).
However, failure to hold at US$70.00 invalidates the short-term recovery scenario to expose the US$67.00/67.00 major support area.
Content is for general information purposes only. It is not investment advice or a solution to buy or sell securities. Opinions are the authors; not necessarily that of OANDA Business Information & Services, Inc. or any of its affiliates, subsidiaries, officers or directors. If you would like to reproduce or redistribute any of the content found on MarketPulse, an award winning forex, commodities and global indices analysis and news site service produced by OANDA Business Information & Services, Inc., please access the RSS feed or contact us at [email protected]. Visit https://www.marketpulse.com/ to find out more about the beat of the global markets. © 2023 OANDA Business Information & Services Inc.
Latest posts by Kelvin Wong (see all)
- SEO Powered Content & PR Distribution. Get Amplified Today.
- PlatoData.Network Vertical Generative Ai. Empower Yourself. Access Here.
- PlatoAiStream. Web3 Intelligence. Knowledge Amplified. Access Here.
- PlatoESG. Carbon, CleanTech, Energy, Environment, Solar, Waste Management. Access Here.
- PlatoHealth. Biotech and Clinical Trials Intelligence. Access Here.
- Source: https://www.marketpulse.com/commodities/wti-oil-technical-momentum-term-downside-momentum-has-eased/kwong

