VeChain almost shot up 50% during the beginning of the year. Over the last week, the altcoin maintained a bullish stance with a 17% appreciation, but VET fell by over 6% on the daily chart. The coin is correcting itself on its chart now.
The technical outlook of VeChain depicted that the bears were slowly taking charge of the price. Demand for the altcoin noted a slump as buyers defined a fall in accumulation at press time. At the moment, VET is slowly moving towards a significant support level.
A drop below which can cause VET to become completely bearish. This price pullback will continue if VET doesn’t topple its immediate resistance mark over the subsequent few trading sessions.
With Bitcoin revisiting the $23,000 price zone, it could be possible that most altcoins will further depreciate on their respective charts. For VET to breach the price ceiling, it is essential that broader market support return to the market.
VeChain Price Analysis: One-Day Chart
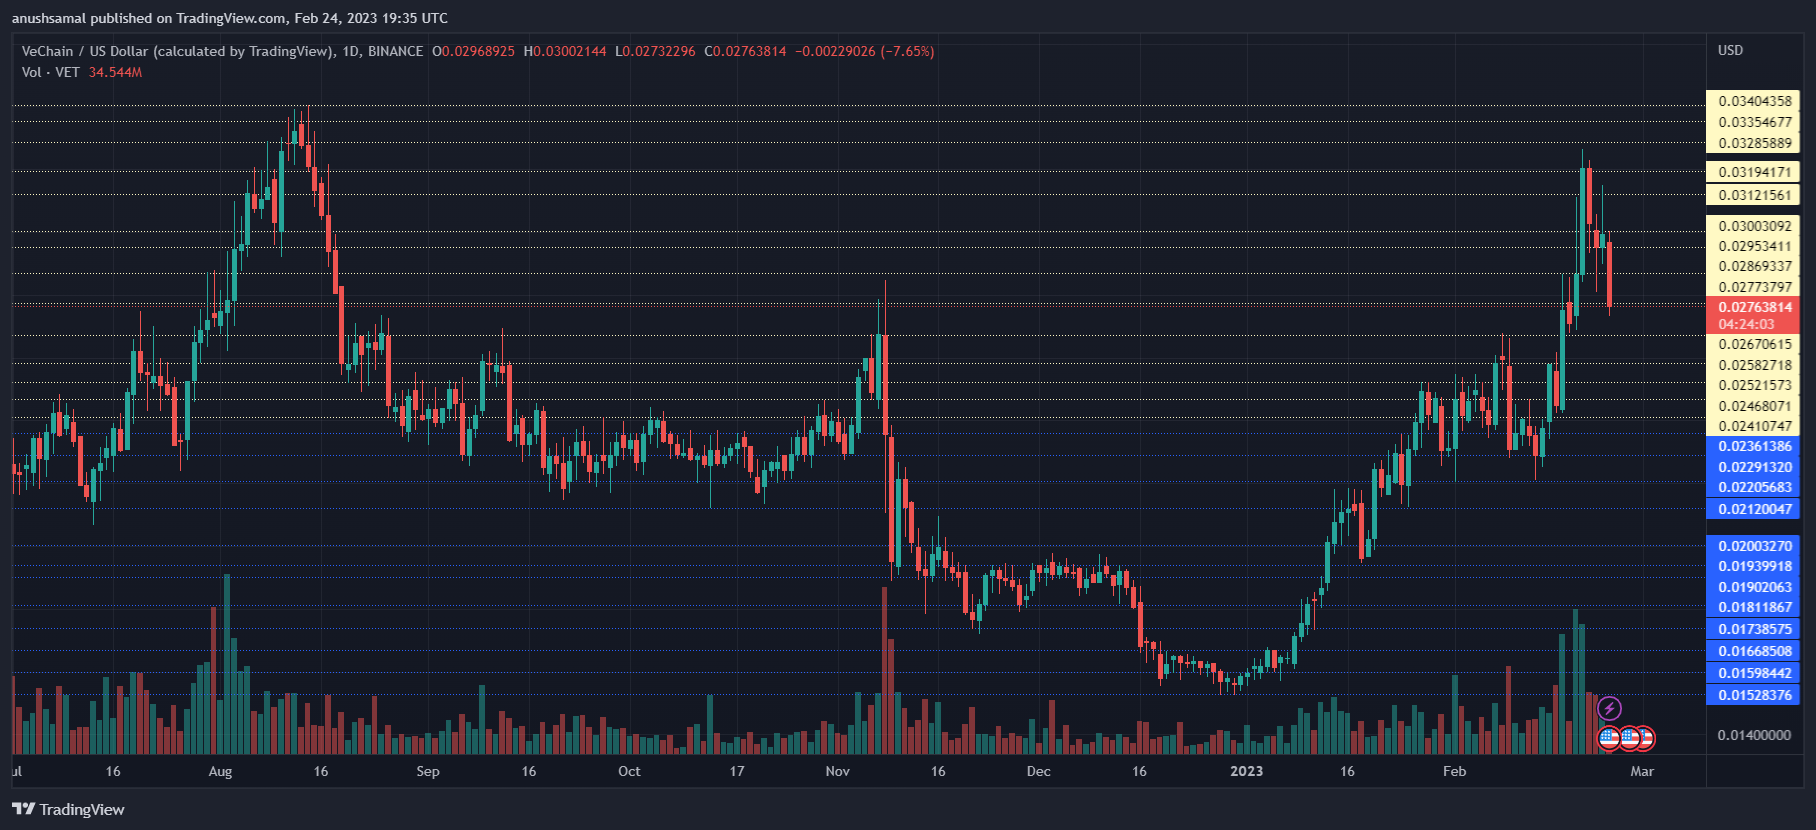
VET was trading at $0.0276 at the time of writing. The altcoin struggled to overcome the overhead resistance of $0.0286; however, a move above that level can push the altcoin to trade near $0.0300. If VET’s price fell further, the first and second stops were $0.0240 and $0.234.
The amount of VeChain traded in the last session was red, indicating more selling power for the altcoin. If the coin touches the $0.0234 level, it could propel the price to $0.0277, which would help VET log further gains. VeChain may attempt to breach the $0.0310 level if demand comes back.
Technical Analysis
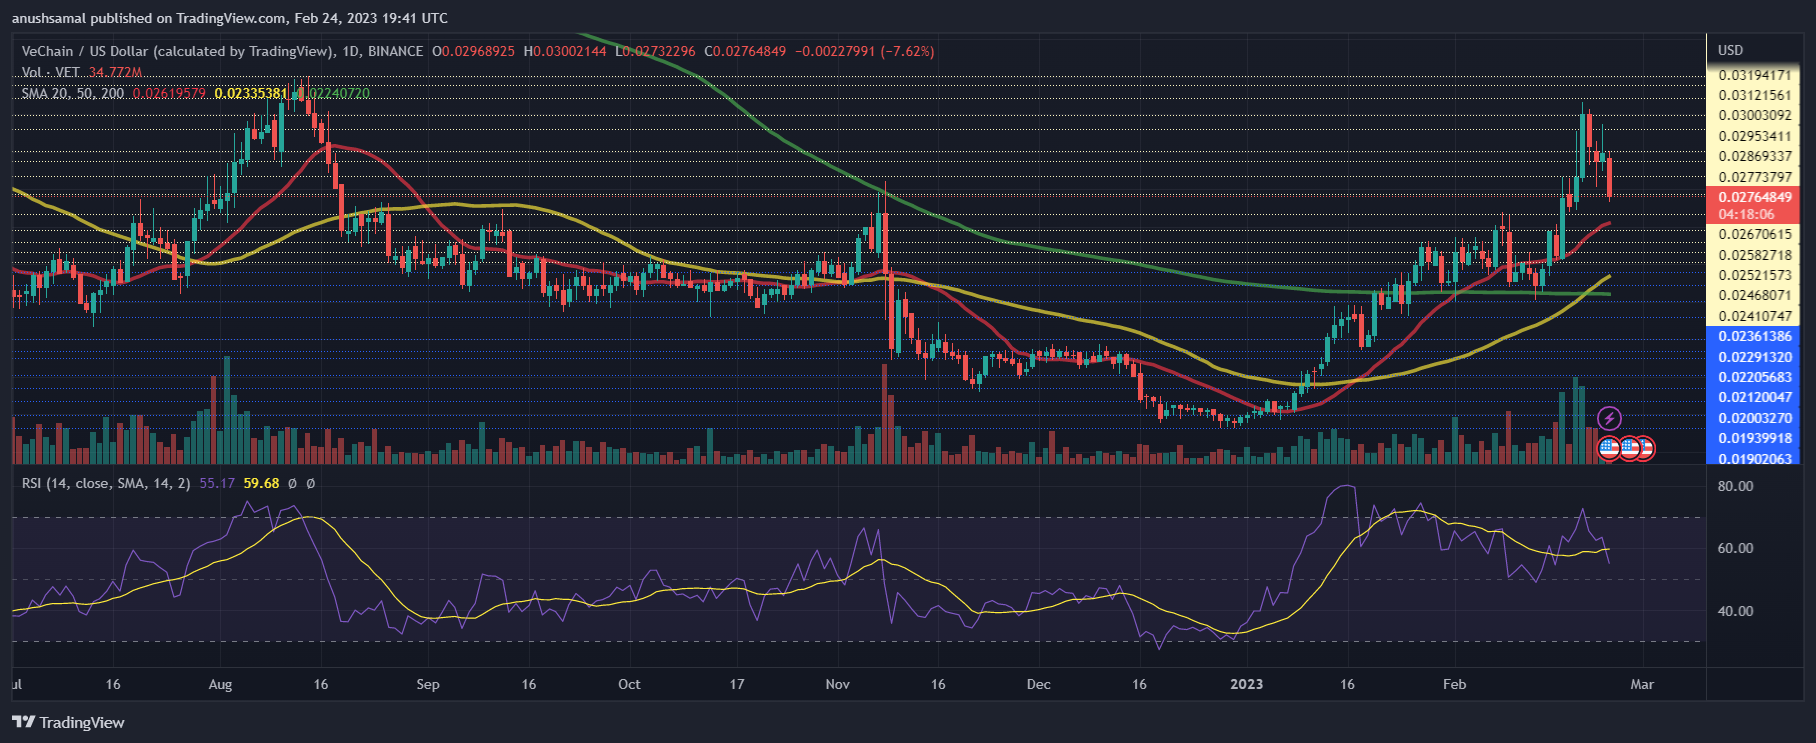
With the recent fall in price, buyers have started to lose interest in the altcoin. The Relative Strength Index dipped over the past few trading sessions and stood below 60.
This indicated that buying pressure was falling on the chart. Similarly, the VET price fell below the 20-Simple Moving Average line. This reading indicated that sellers were driving the price momentum in the market.

The Parabolic SAR depicts the price movement and direction. The indicator formed the dotted lines underneath the price candlesticks; this meant that the coin was still headed in an upward price direction. The other technical indicators showed how the price action displayed mixed signals at press time.
The Directional Movement Index was negative, as the -DI (orange) line was above the +DI (blue) line. This meant that the price was moving south over the past trading sessions.
The Average Directional Index (red) moved above the 40-mark. It usually means that the current price momentum is gaining strength, which could mean that VET might lose value before it reverses the price action.
Featured Image From UnSplash, Charts From TradingView.com.
- SEO Powered Content & PR Distribution. Get Amplified Today.
- Platoblockchain. Web3 Metaverse Intelligence. Knowledge Amplified. Access Here.
- Source: https://www.newsbtc.com/altcoin/will-vechain-price-orchestrate-another-leg-up-anytime-soon/

