Talking Points
- US Crude Oil falls after Saudi Arabia cuts prices
- Technical Analysis Weekly Chart
- Technical Analysis 8-Hour Chart
Crude Oil prices ended 2023 with 3 months of consecutive declines, prices fell from a peak of $95 in September 2023 down to $70.75 today, a drop of almost 25% in price, shrugging off all the extra premiums resulting from the current political risks, and taking the markets back closer to its standard supply and demand dynamics. The latest COT report shows Commercials are at their 15-year extreme long levels, and possibly signaling a change in sentiment. This week, traders will be looking forward to US Crude Oil inventories which are expected to be at -1.2M, compared to its latest January 4th, 2024, reading of -5.5M.
Weekly Chart
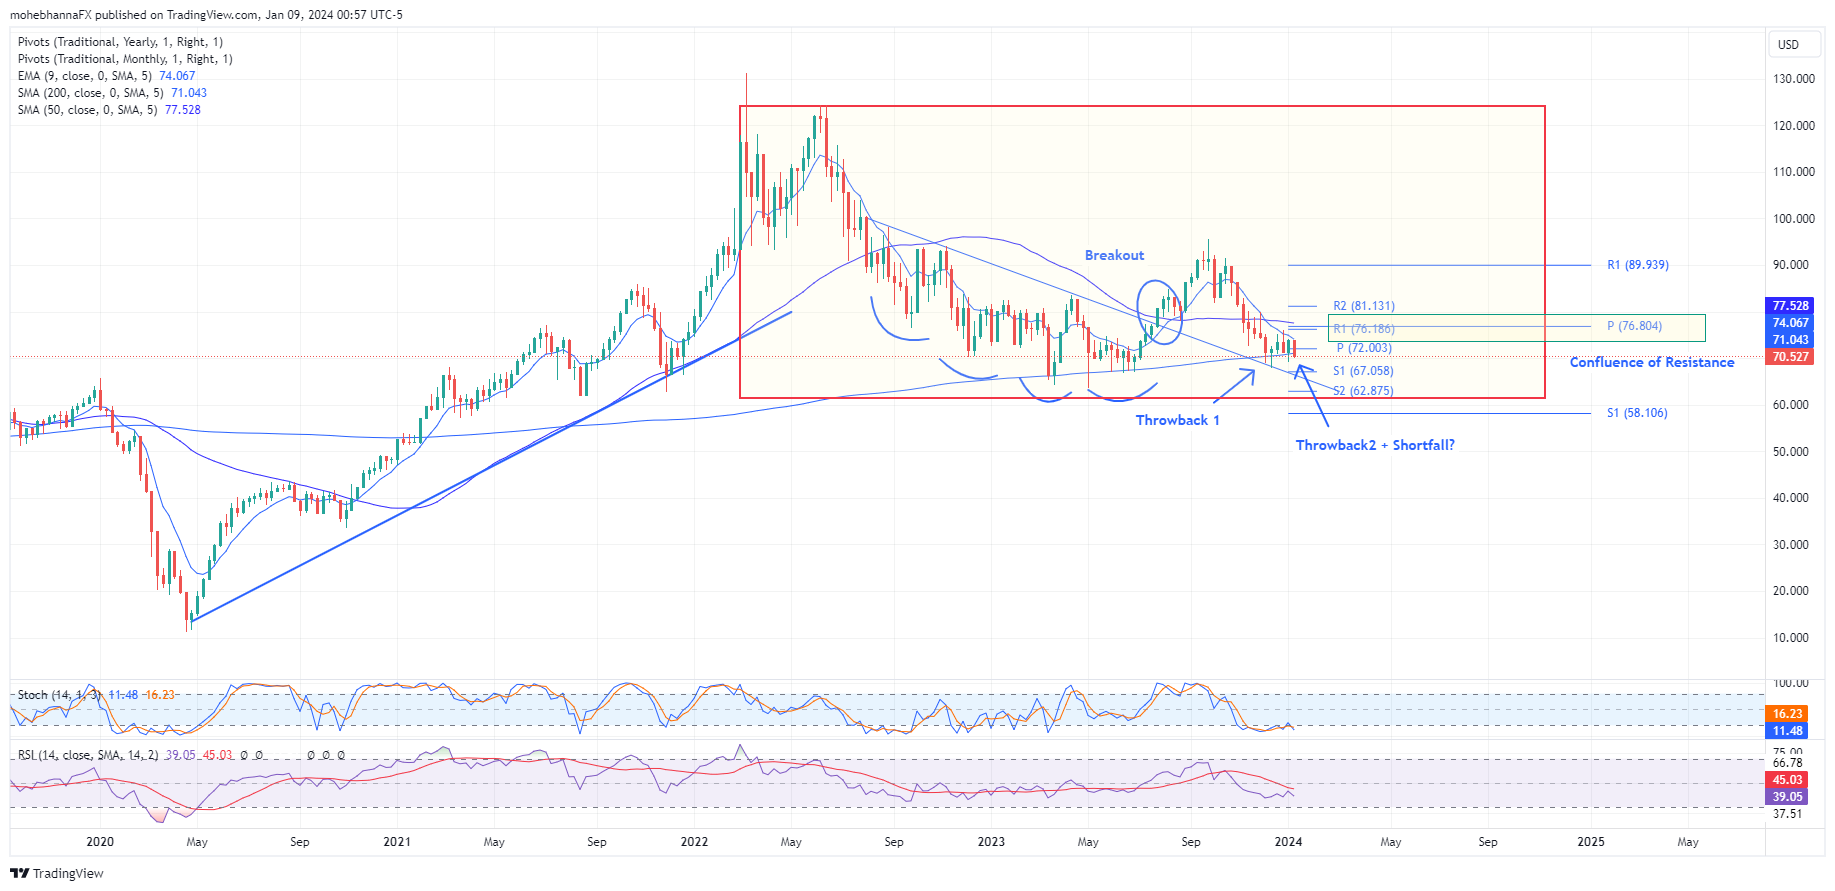
- Crude Oil price has been trading in an uptrend that began in early 2020, the price reached a peak of $131.00 up from its historic low of $11.50, the highlighted area on the chart can be a flag formation which if true, can be a continuation pattern.
- Price action broke out and closed above the resistance line connecting the bases for multiple bottoms formation as marked on the chart.
- The breakout was followed by a throwback reaching the extension of the resistance line (Throwback 1), this was followed shortly after by Throwback 2 which if remains intact, can be considered a shortfall as some expect buyers may enter ahead of the anticipated technical level.
- A confluence of resistance lies above price action represented by the annual pivot point and Monthly R1 calculations at the range of $76.18 – $76.80.
- So far, the price is finding support at its intersection with its SMA200, however, the price has been trading below the other commonly used averages, SMA50 and EMA9.
- RSI and Stochastic indicators reflect a slight positive divergence, as price action remains sideways while indicators are attempting higher highs.
8-Hour Chart
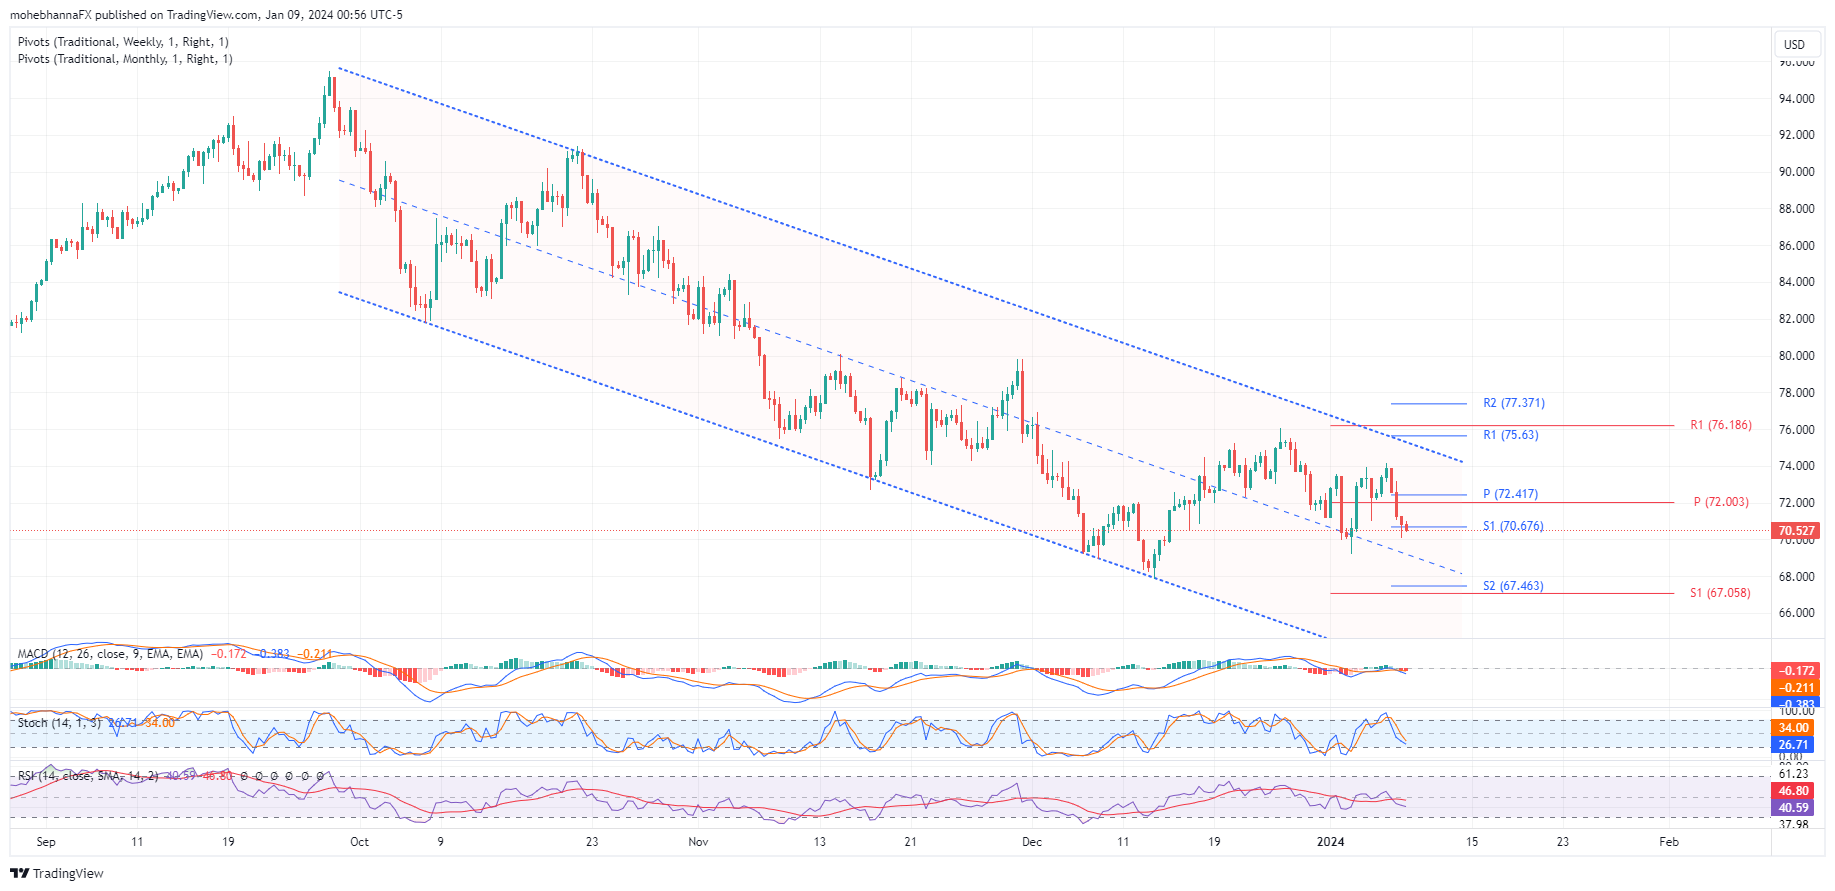
- Price continues to trade within a declining equidistant channel marked by dotted lines on the chart, a potential shortfall may be in place as price action is attempting to find support ahead of the channel median line.
- Price action broke and closed below its monthly and weekly pivot points and currently attempting to find support at its weekly S1 level, any reversal in price action will be met by broken support turned resistance represented by the broken pivot points level.
- RSI and Stochastic indicators are also attempting a reversal ahead of reaching their oversold levels, the Stochastic %K line is attempting to cross above the %D line.
- MACD line remains tangled with its signal line near its neutral levels signaling a potential breakout regardless of direction
Content is for general information purposes only. It is not investment advice or a solution to buy or sell securities. Opinions are the authors; not necessarily that of OANDA Business Information & Services, Inc. or any of its affiliates, subsidiaries, officers or directors. If you would like to reproduce or redistribute any of the content found on MarketPulse, an award winning forex, commodities and global indices analysis and news site service produced by OANDA Business Information & Services, Inc., please access the RSS feed or contact us at [email protected]. Visit https://www.marketpulse.com/ to find out more about the beat of the global markets. © 2023 OANDA Business Information & Services Inc.
Latest posts by Moheb Hanna (see all)
- SEO Powered Content & PR Distribution. Get Amplified Today.
- PlatoData.Network Vertical Generative Ai. Empower Yourself. Access Here.
- PlatoAiStream. Web3 Intelligence. Knowledge Amplified. Access Here.
- PlatoESG. Carbon, CleanTech, Energy, Environment, Solar, Waste Management. Access Here.
- PlatoHealth. Biotech and Clinical Trials Intelligence. Access Here.
- Source: https://www.marketpulse.com/commodities/us-crude-oil-price-action-technical-analysis/mhanna

