Executive Summary
- The Ethereum staking pool has experienced a significant trend change marked by an increasing amount of validators exiting since October. This development correlates with a broader bullish uptrend across digital asset markets.
- The increased number of validator exits has contributed to a decline in daily ETH issuance, which is related to the amount of active ETH within the staking pool.
- Simultaneously, we have seen increased network activity, driven by renewed interest in tokens and stablecoins. This is reflected by an increase in gas fees being burnt via EIP1559 triggering a deflationary turn the ETH supply.
Undoubtedly, the most significant headline of the past week was the resignation of Binance CEO CZ. The settlement amount reached with the authorities stands at $4.3 billion, with many seeing this pivotal event as a marker for the end of the ‘wild-west’ years of the digital asset industry.
Following this announcement, the price of BNB experienced a -9.1% decline. However, this market reaction is relatively moderate when compared to previous price drops, such as the -24% fall when the SEC announced charges earlier in the year.

Following this news, the Binance exchange experienced an uptick in withdrawal activity across major assets. The aggregate balance of a range of DeFi ‘blue-chips’ decreased by -6.7% within the first 24 hours, while BTC, ETH and Stablecoin balances declined by -4.4%, -4.9% and -2.2%, respectively.
However, in the six days following CZ’s resignation, these exchange balances saw a recovery, with all four token categories seeing a slowdown of outflows, and indeed a return to net inflows. In many ways this demonstrates a level of trust users have in the Binance platform. It could also be argued that confidence may even improve given the settlement requirement for US regulator oversight over the next three years.

Validator Exits
While not capturing the same headlines as the Binance settlement, the Ethereum staking pool has has experienced a notable shift since the start of October. An increasing number of validators are currently exiting the staking pool.
Shanghai enabled stake withdrawals, and was followed by a surge in validators exiting, claiming rewards, and reshuffling their staking provider and setup. Exiting events averaged 309 validators per day during this time.
Since early October, we have seen a gradual increase in exiting events, reaching an average of 1018 validators per day. This uptick aligns with the recent uptrend in spot prices across digital asset markets.

Consequently, the Total Effective Balance, representing the ETH in the Staking Pool, that is actively participating in Proof-of-Stake Consensus, has slowed in its growth and is now experiencing the first decline since the Shanghai upgrade.
The gradient of the Total Effective Balance began to flatten out in mid-October, registering an average increase of 0.1% to 1% per day, more than halving the growth rate sustained since May.

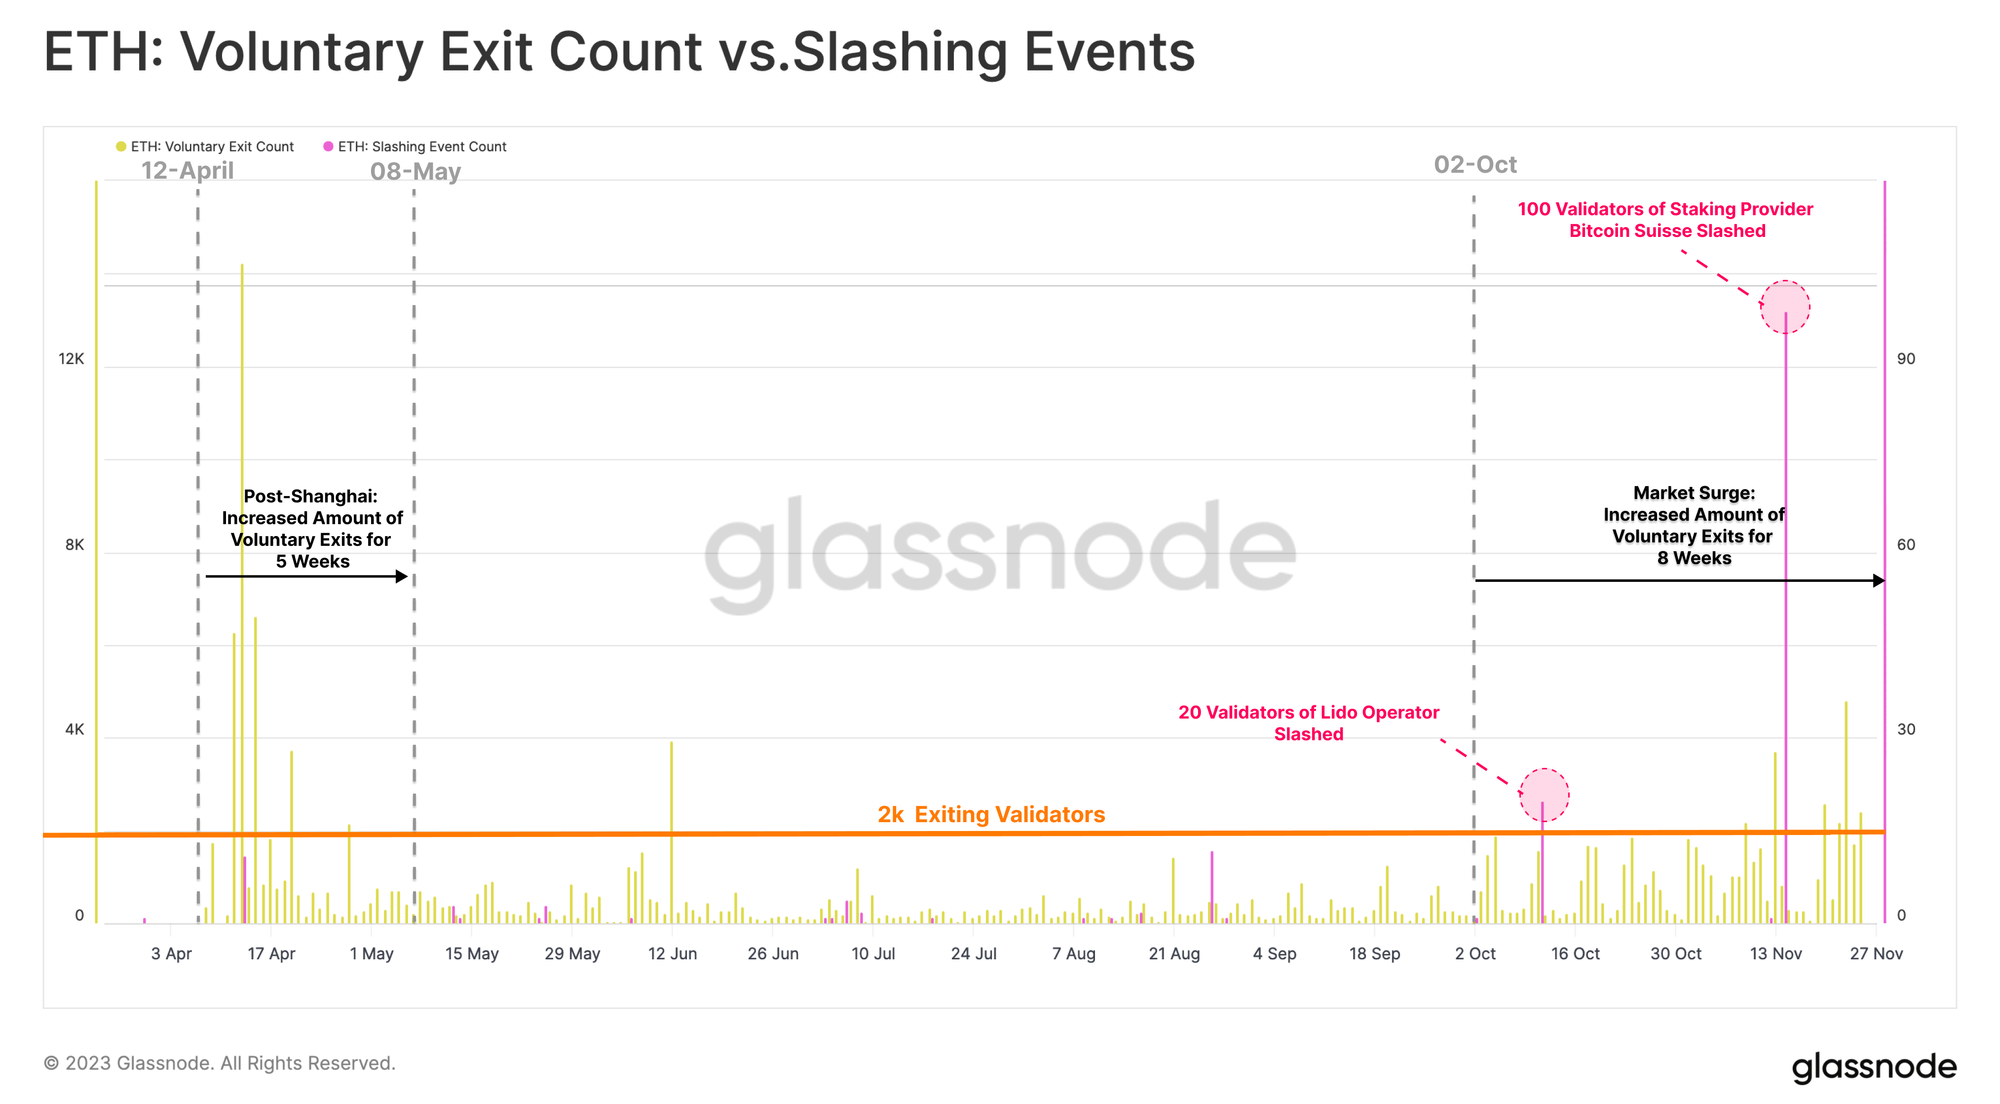
Upon closer examination of exiting validators, we can see it is largely driven by voluntary exits over the past eight weeks. Voluntary exits refer to stakers who independently choose to exit the staking pool. This is distinct from slashing, which is a penalty applied to validators which violate protocol rules.
In the same timeframe, only two slashing events have occurred, one of which was substantial, involving 100 newly-entered validators, slashed for simultaneously signing two different blocks of the network.
Exiting validators can be further categorized by the staker type they belong to. This reveals a few interesting trends:
- Centralized exchanges (CEXs) have consistently dominated stake withdrawal events since October, with Kraken and Coinbase seeing the largest outflows.
- Liquid Staking Providers have also experienced a modest uptick in withdrawn stake as well, with Lido remaining the largest player in the space.
There are a few points which may be driving this investor behavior:
- Investors opting to change their staking setup, for example transferring stake from CEXs to Liquid Staking Providers (perhaps due to ongoing regulatory concerns).
- Investors with access to US capital markets may be rotating capital towards safer assets such as US treasuries as interest rates remain elevated relative to ETH staking returns.
- Investors may also be seeking greater liquidity for held ETH in anticipation of an imminent market uptrend, rather than less liquid staked ETH.
Kraken and Coinbase stand out as top providers seeing withdrawals, while Lido leads in exits among Liquid Staking Providers. However, these same entities, with Lido taking the lead, are also the primary recipients of stake deposits, showing a net stickiness and dominance of these large pools of capital.

On a net change basis, Lido continues to grow in dominance, increasing its aggregate staked balance by 468k ETH. Across CEXs, Coinbase and Binance have seen a net increase in their staking balances, whilst Kraken has reduced its stake balance by -19.4k ETH. Among staking providers, HTX and Staked.us exhibit the most significant reduction in their staking balances, each decreasing by over ETH -44k.

Aligned with the observed reduction in Effective Balance, there has been a corresponding decrease in ETH issuance. The daily issuance of ETH to validators is contingent on the number of Active Validators, or respectively, the Total Effective Balance within the staking pool.
As the growth rate of validators slows and declines, the daily ETH issuance has experienced a corresponding slowdown. Over the last 7-days, the growth rate of ETH issuance has slowed by up to 0.5% per day. Notably, the rate of issuance has decreased for the first time in recent days.

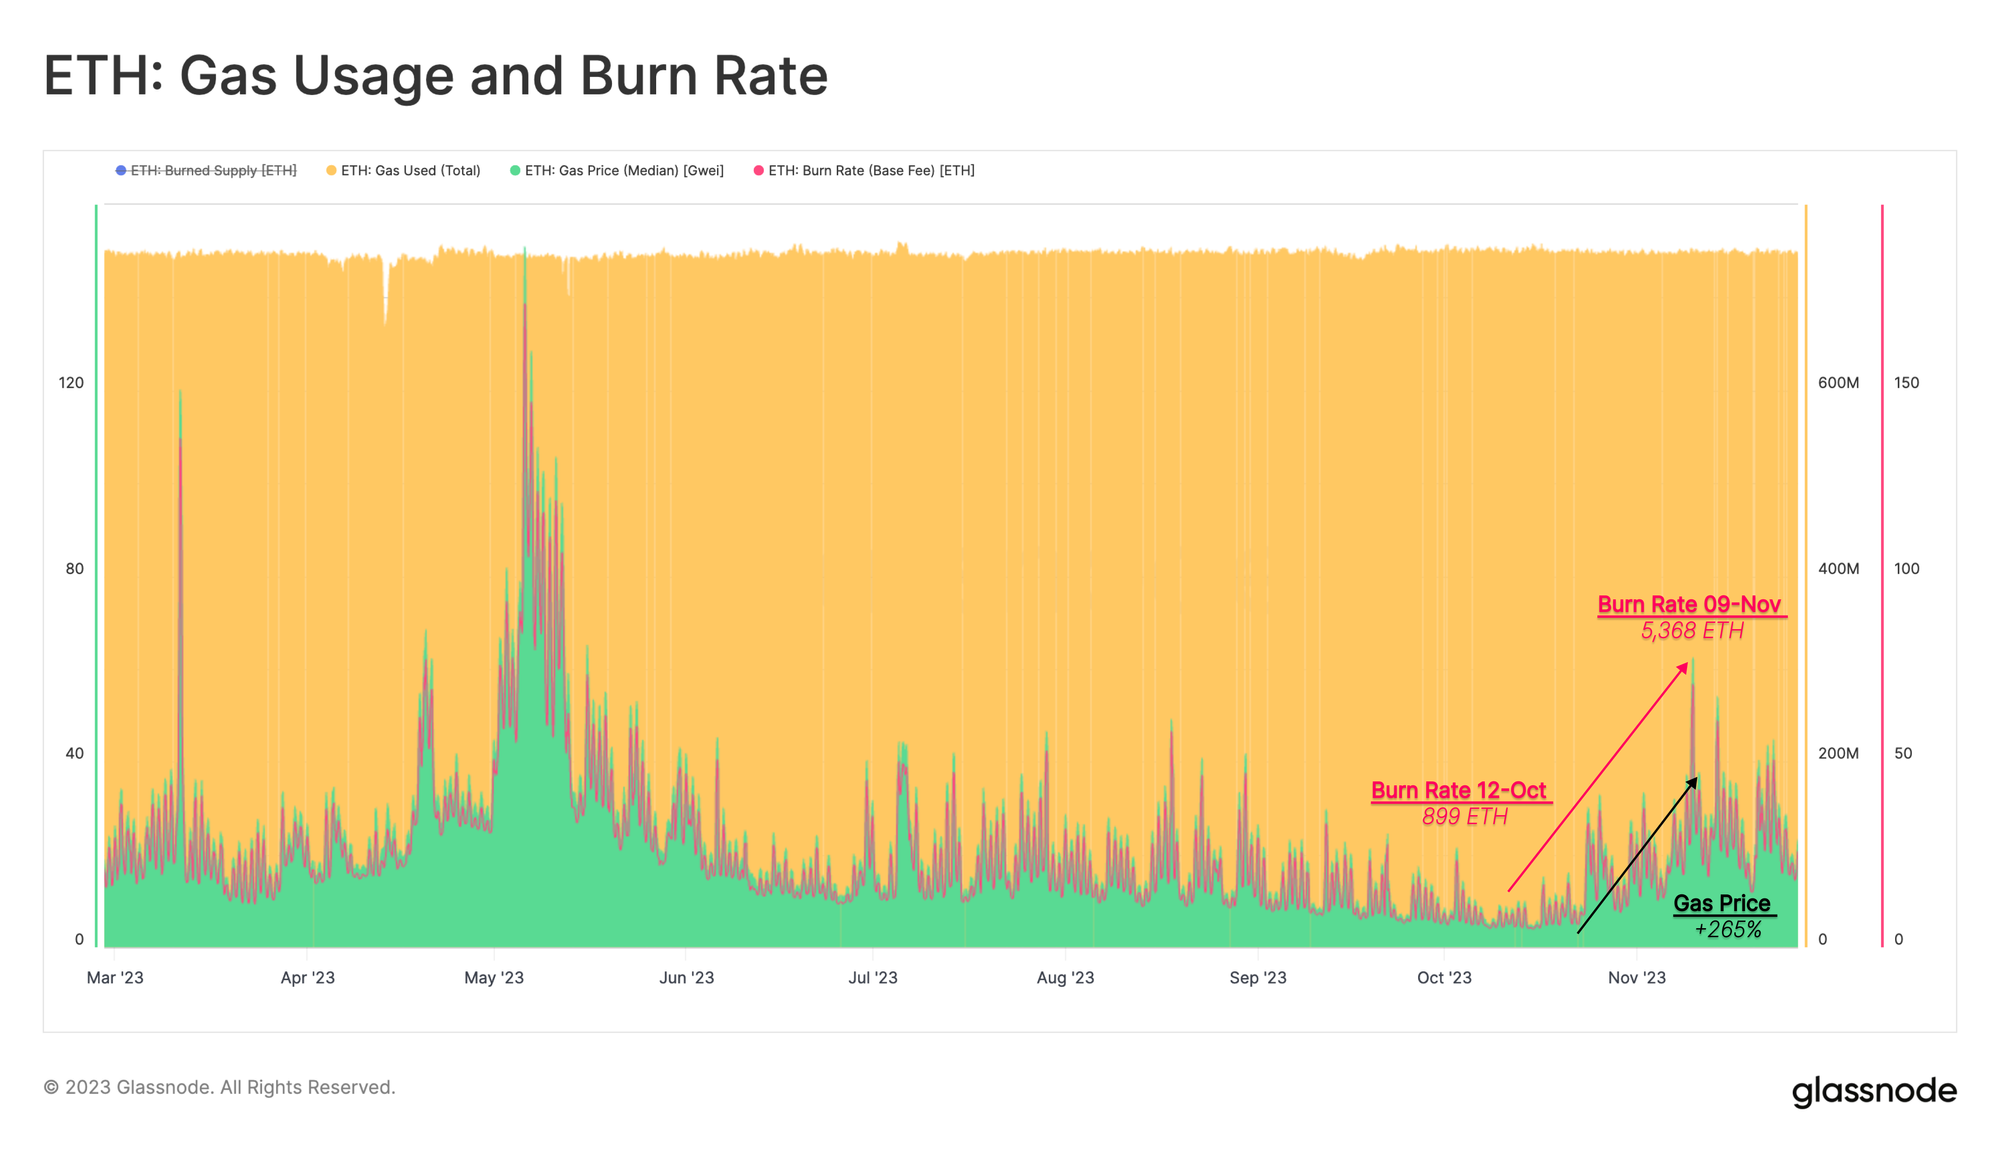
As issuance rates experience a decline, we now turn our attention to the complementary aspect of the equation—the burn rate. Initiated with the London hardfork in 2021, the fee-burning mechanism of EIP1559 involves the burning of a portion of transaction fees, setting the stage for the ETH supply to become deflationary with elevated network usage.
In tandem with rising gas prices, which signify growing transaction demand on the Ethereum network, the daily amount of ETH fees burned has increased as well. In October, we see the amount of ETH fees being burnt reaching 899 ETH per day. Fast forward almost one month, and the accumulated fees burnt has now reached 5,368 ETH.
We can also assess a detailed breakdown of gas usage across various transaction types. These metrics enable us to identify activities that predominantly contribute to the supply burn.
Upon examining the two sectors that historically fuelled Ethereum network adoption, it becomes evident that both NFT transactions and DeFi transactions are contributing relatively little over the past four months, with decreases of -3% and -57%, respectively. Both sectors have seen declining adoption and are contributing little to the latest surge in activity on-chain.

The recent surge in network activities is primarily attributed to token transfers and stablecoins. Gas usage for tokens has risen by +8.2% over the last three months, whilst stablecoin gas usage has increased by +19%. This suggests a potential light capital rotation is taking place towards longer-tail assets as confidence in market strength increases.

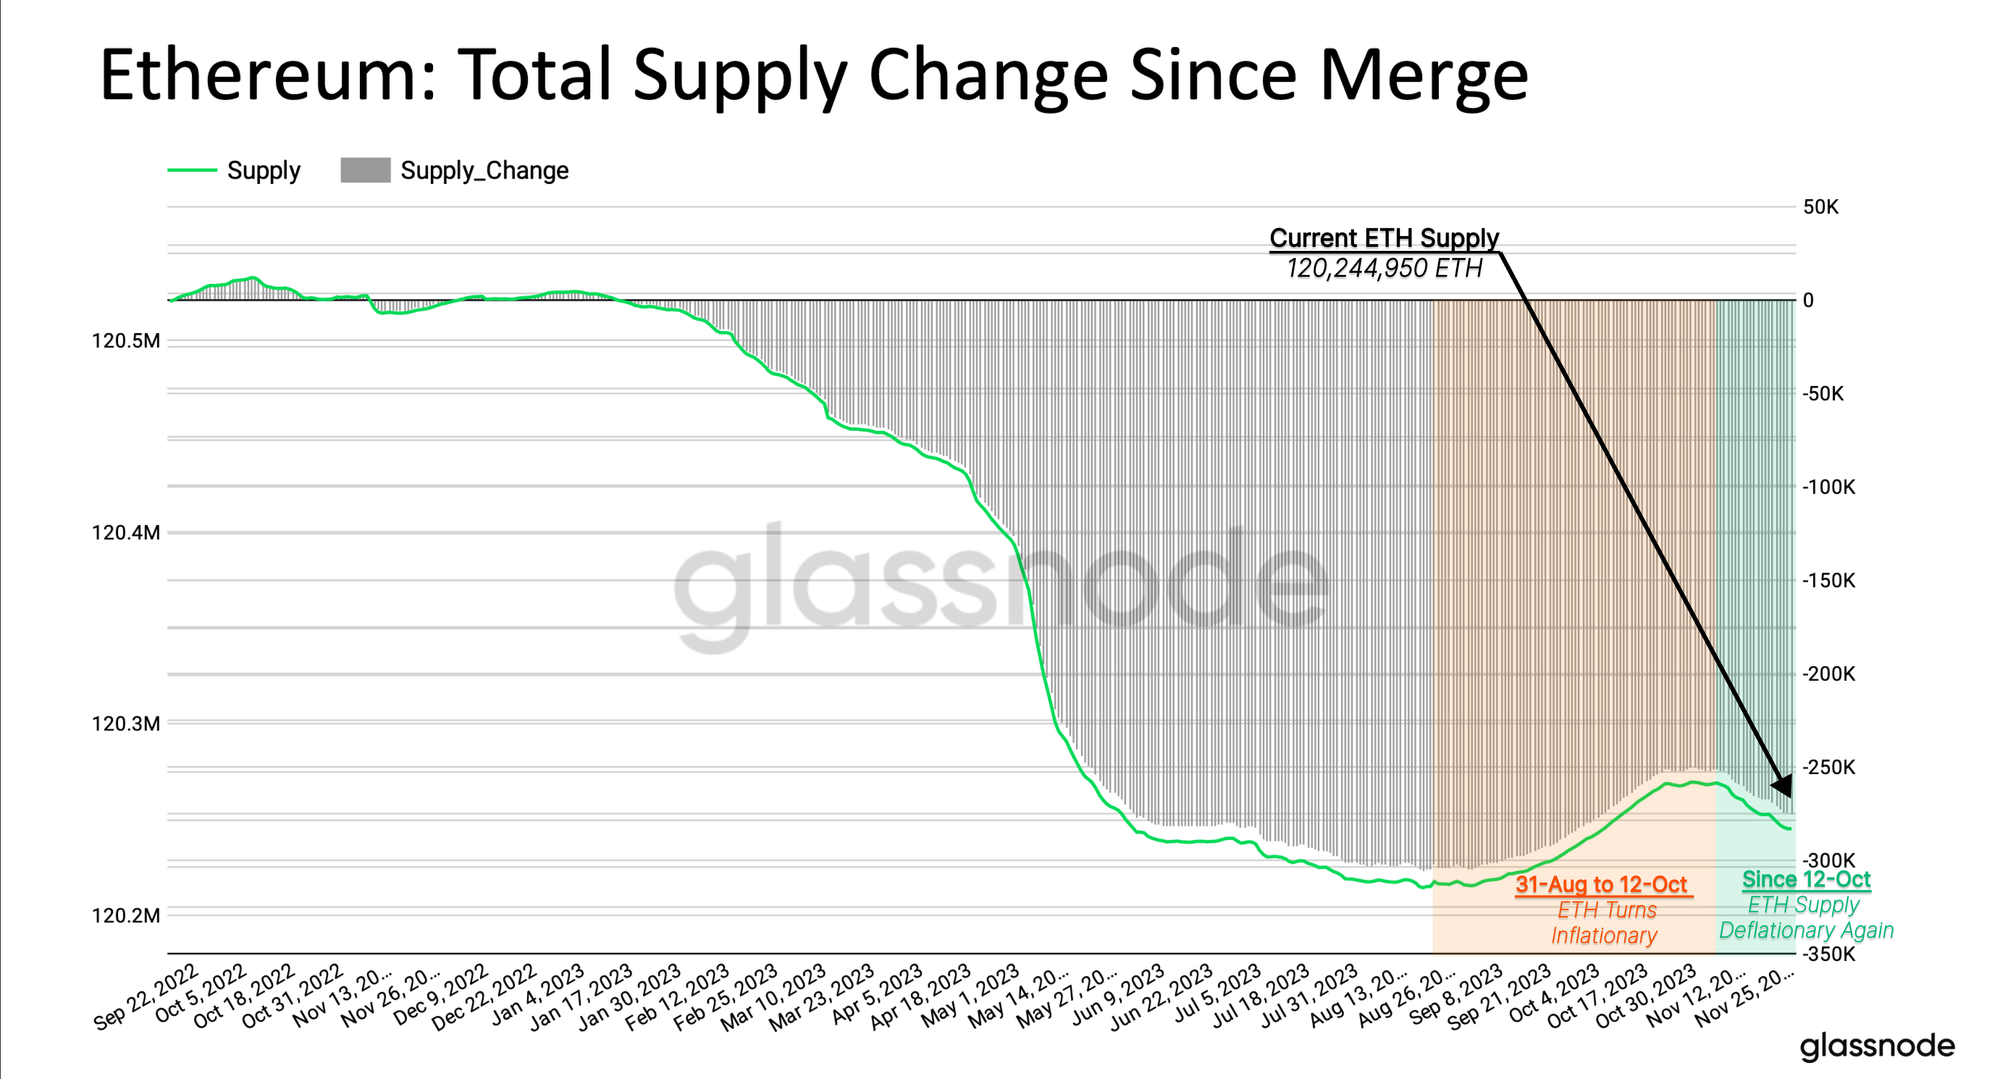
Since the London hardfork, the ETH transitioned from net inflationary towards a state of equilibrium and outright or deflation. The network experienced a brief period of net inflation between August and October as a result of lower network activity.
In recent weeks, as a result of both declining issuance rates, and larger volumes of supply burnt, the aggregate ETH supply has turned net deflationary once again.
Summary and Conclusions
Recent weeks have seen a notable shift in the Ethereum staking pool dynamics, as the number of validators exiting the pool starts to increase. This has resulted in a slowdown of the growth rate for ETH issuance, and the first reducion in the staking pool balance since the Shanghai upgrade.
Furthermore, a recent surge in network activities, particularly driven by token transfers and stablecoins, has led to elevated transaction demand. This has in turn put upwards pressure on gas prices, creating an increase in daily ETH fees burned via EIP1559.
These two forces in combination have resulted in the global ETH supply turning deflationary once again. In this context, the interplay of these factors underscores the dynamic nature of the Ethereum network, supply and its responsiveness to trends in market activity and adoption.
Disclaimer: This report does not provide any investment advice. All data is provided for information and educational purposes only. No investment decision shall be based on the information provided here and you are solely responsible for your own investment decisions.
Exchange balances presented are derived from Glassnode’s comprehensive database of address labels, which are amassed through both officially published exchange information and proprietary clustering algorithms. While we strive to ensure the utmost accuracy in representing exchange balances, it is important to note that these figures might not always encapsulate the entirety of an exchange’s reserves, particularly when exchanges refrain from disclosing their official addresses. We urge users to exercise caution and discretion when utilizing these metrics. Glassnode shall not be held responsible for any discrepancies or potential inaccuracies. Please read our Transparency Notice when using exchange data.

- SEO Powered Content & PR Distribution. Get Amplified Today.
- PlatoData.Network Vertical Generative Ai. Empower Yourself. Access Here.
- PlatoAiStream. Web3 Intelligence. Knowledge Amplified. Access Here.
- PlatoESG. Carbon, CleanTech, Energy, Environment, Solar, Waste Management. Access Here.
- PlatoHealth. Biotech and Clinical Trials Intelligence. Access Here.
- Source: https://insights.glassnode.com/the-week-onchain-week-48-2023/

