
Published 7 hours ago
Over the past two months, the Ape price showcased a sustained recovery in the daily chart. This bullish rally was led by a rising parallel channel pattern and doubled the Ape Coin’s market value from its November 2022 low. However, in theory, this pattern is known as a bearish continuation pattern, intensifying the selling pressure upon the breakdown of the support trendline. Having said that, the buyers gave an upside breakout from the patterns trendline but is still struggling to offer a follow-up rally.
advertisement
Key points:
- The multiple rejection candles at $6 indicate the sellers continue to defend this level
- A bullish crossover between the 50-and-100-day EMA could encourage the resumption of a bullish recovery
- The intraday trading volume in Apecoin is $173. Million, indicating a 26% gain
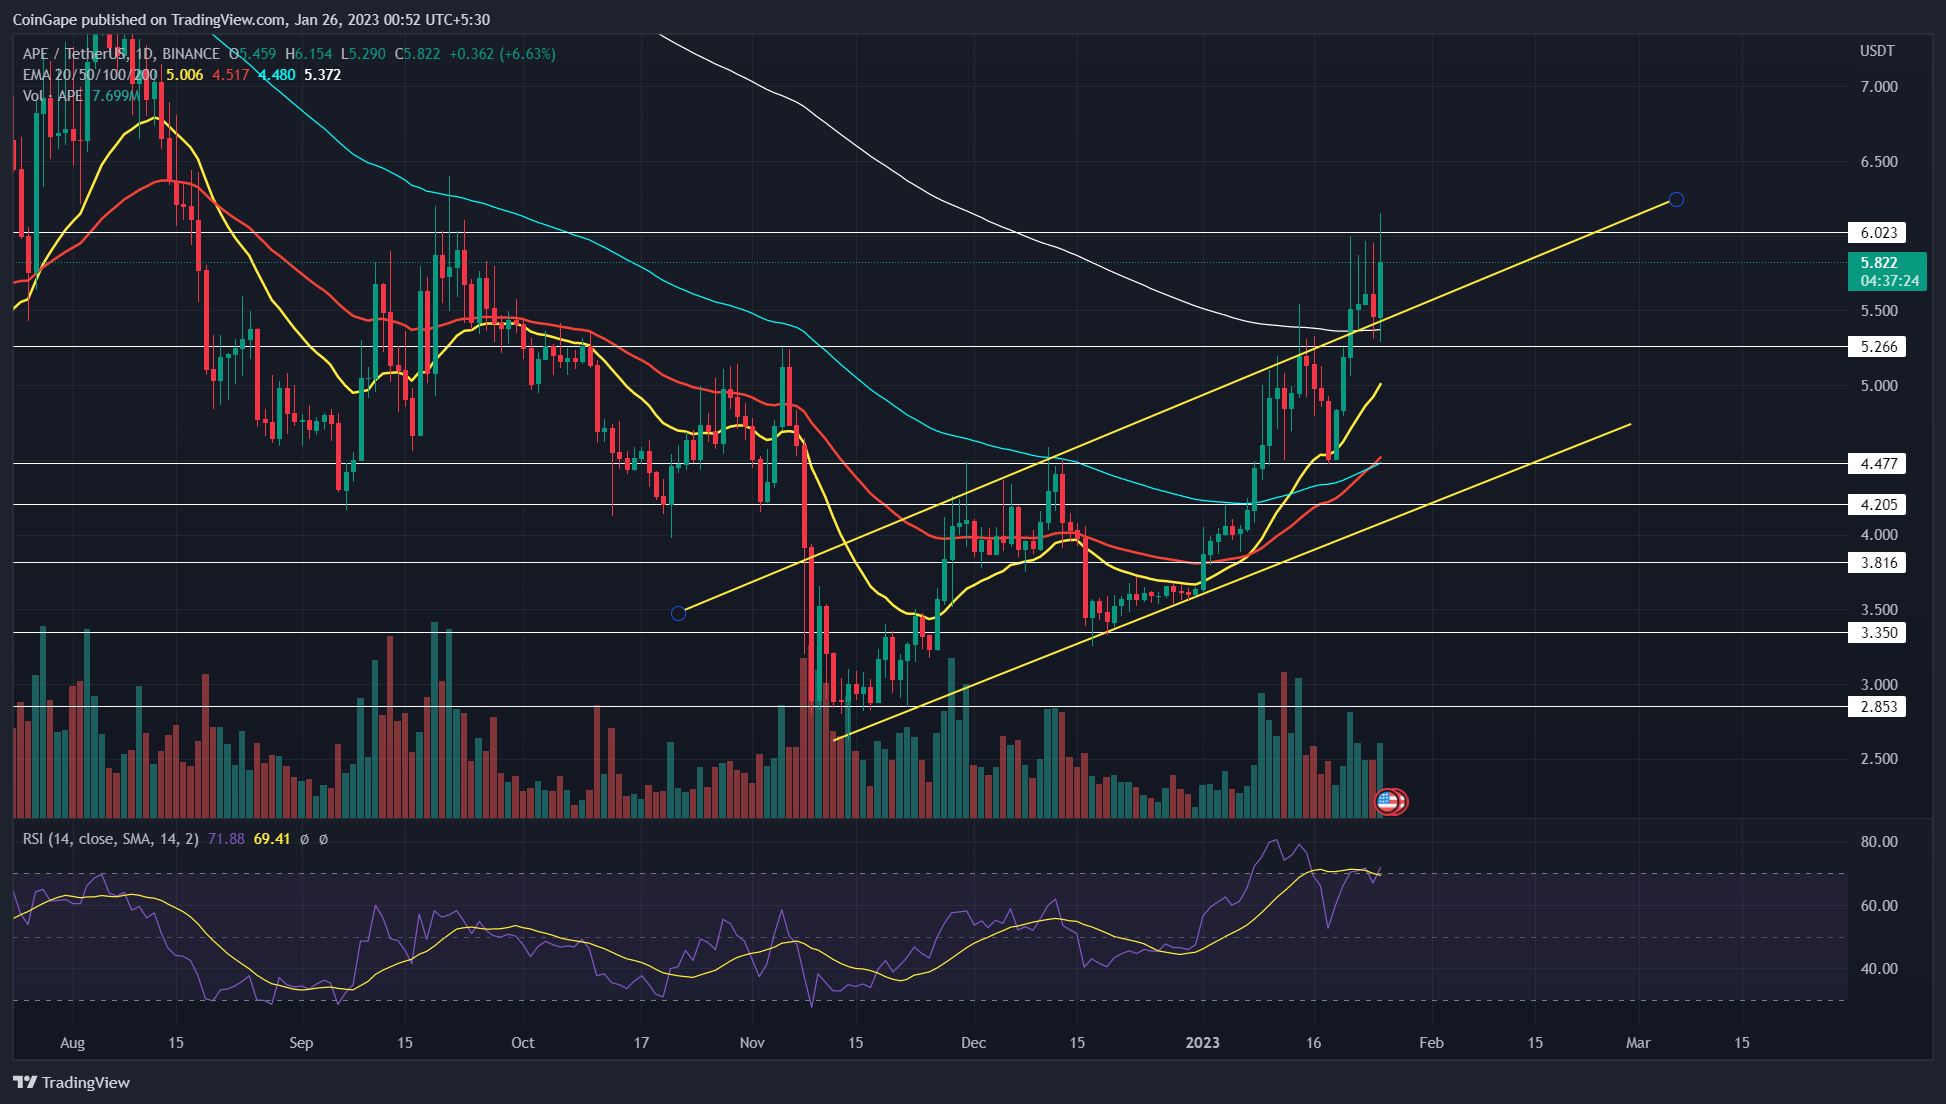
Source: tradingview
In a strong bullish scenario, an upside breakout from the patterns resistance trendline will undermine this bearish thesis and increase the buying pressure. There, on January 21st, Apecoin price gave a high momentum breakout from the pattern’s resistance trendline, offering an entry opportunity for sidelined traders. This breakout was supposed to trigger a significant rally, but instead, the coin price is moving sideways, struggling to breach $6.
The coin currently trades at the $5.84 mark and shows several higher price rejection candles at $6 in the last five days. These rejection candles signal the exhausted bullish moment and the ability of buyers to sustain higher prices.
Trending Stories
Also Read: Top 10 DeFi Lending Platforms In 2023
Thus, if the selling pressure persists, the coin price will likely break the rising trendline and validate the prior breakout as a fakeout or bull trap. This breakdown will encourage longer corrections and may plunge the price back to $4.47.
Conversely, the traders looking for a long entry opportunity should wait for a daily candle closing above $6.
Technical Indicator
RSI: despite a rising price action, the RSI slope showing a downfall indicates a bearish divergence. This divergence with price action showcase and additional confirmation for coming correction.
advertisement
EMAs: the recently reclaimed 200-day EMA moving the $5.2 mark increases the support power of this level.
Apecoin Intraday Price Levels
- Spot price: $5.8
- Trend: Bullish
- Volatility: High
- Resistance level- $6 and $7.64
- Support level- $5.2 and $3.8
Share this article on:
The presented content may include the personal opinion of the author and is subject to market condition. Do your market research before investing in cryptocurrencies. The author or the publication does not hold any responsibility for your personal financial loss.
- SEO Powered Content & PR Distribution. Get Amplified Today.
- Platoblockchain. Web3 Metaverse Intelligence. Knowledge Amplified. Access Here.
- Source: https://coingape.com/markets/traders-should-beware-of-this-bull-trap-if-they-are-buying-apecoin/

