- Global manufacturing hubs; South Korea, Singapore & China continued to indicate a weaker external demand environment.
- Several key stock markets; US & Japan are on bullish footing, ignoring global recession risk.
- Higher US consumer confidence & more positive earnings guidance are required to maintain the bullish animal spirits.
- Higher cost of funding & a deeply inverted US Treasury yield curve are key hurdles for the bulls.
The great divergence continues between the state of the real global economy and risk assets such as equities.
Latest data from key global manufacturing hubs in Asia have indicated more potential weakness ahead in the external demand environment for the second half of 2023. South Korea, a key provider of semiconductors and smartphones for the global economy saw its latest full monthly exports figure decline to -6% year-on-year in June, a lower magnitude of -15.2% recorded in May but lower than expectations of a 3% drop. Overall, it’s nine consecutive months of contraction for South Korea’s exports.
In addition, soft data from South Korea’s Manufacturing PMI which tends to have a lead time over exports figures has remained in contraction mode for twelve consecutive months; it fell to 47.8 in June from 48.4 in May.
Data from China’s Caixin Manufacturing PMI which provides coverage for small and medium enterprises fared slightly better than the official NBS Manufacturing PMI for June but remained lackluster; it dipped to a neutral level of 50.5 from 50.9 recorded in May and came in slightly above expectations of 50.2.
Singapore’s non-oil domestic exports (NODX) slumped by 14.7% year-on-year in May, worse than forecasts of an 8.1% decline after a 9.8% reading in April; so far it has marked its eighth consecutive month of contraction.
US Nasdaq 100 and Japan Nikkei 225 were star performers in H1 2023
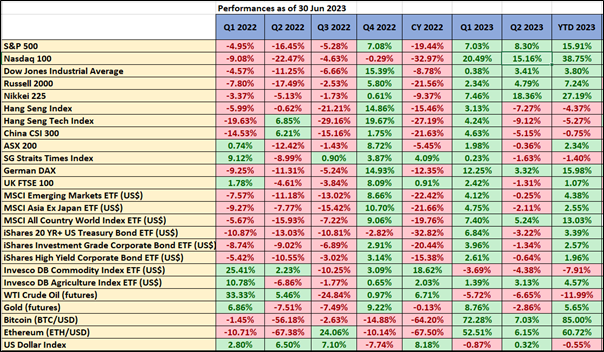
Fig 1: Key cross-assets performances as of 30 Jun 2023 (Source: TradingView, click to enlarge chart)

Fig 2: Nasdaq 100 long-term secular trend as of 30 Jun 2023 (Source: TradingView, click to enlarge chart)
In contrast, several major benchmark stock indices have continued to shrug off these “real negative growth backdrop”, entered bull market territories, and staged stellar performances. The top performer was the US Nasdaq 100 assisted by the Artificial Intelligence (AI) equity theme play rocketed to a gain of 38.75% in the first half of 2023 and outperformed the MSCI All-Country World Index which recorded a positive return of 13.03% over the same period.
Japanese equities also performed well in the first half; the Nikkei 225 rallied by 27.19%, and the bulk of H1 2023 gains came from Q2 (+18.36). Thanks to a change in corporate governance that favoured shareholders’ activism, lower valuation over the US stock market, and rosy foreign funds’ inflows reinforced by prominent value investor, Warren Buffet’s increased stakes in several major Japanese trading firms made over the first six months.
In contrast, other Asian stock markets in general have been trapped in a muted tone due to a slowing China economy after a diminished growth spurt from the removal of stringent Covid-19 lockdown measures and rather lukewarm monetary and fiscal stimulus measures being implemented at this juncture. The MSCI All Country Asia ex-Japan has managed to score only a meagre gain of 2.55% in the first half, which still has a significant gap to cover to recoup its annual loss of -21.66% posted in the prior year.
Over in Europe, Germany’s DAX managed to squeeze an H1 2023 return of 15.98% but do take note the bulk of its gain came in Q1 as the lackluster external growth environment has triggered a negative ripple effect where the DAX’s Q2 performance only stood at 3.32% that’s a huge gap of around 1,180 basis points over Nasdaq’s Q2 return of 15.16%.
Markets are always forward-looking, around the end of Q1 2023, the bullish camp for equities had a “Fed Pivot” narrative where there were significantly high odds being priced into the Fed funds futures market that advocated rate cuts of 75 bps to 100 bps in the second half of 2023.
Right now, given the Fed’s latest monetary policy guidance is to have “higher interest rates for longer periods”, rate cuts pricing in the futures market for H2 has evaporated, and even though further hikes may not be implemented in 2024 after two more hikes on the Fed funds rate that are being priced in before 2023 ends to bring its likely terminal rate to 5.50% to 5.75%, the start of an easing cycle may only kick in during the second half of 2024 based on latest data from CME FedWatch tool at this time of the writing.
Thus, with the liquidity punch bowl being taken away for now. What are the possible catalysts that can continue to drive the positive animal spirits in the US stock market that can increase the odds of spreading to the rest of the world?
Higher consumer confidence and better-than-expected earnings guidance
So far, US consumer confidence has been trending up modestly since July 2022. The final June reading of the University of Michigan Consumer Sentiment Index has been revised higher to 64.4, its highest level in four months. Higher consumer confidence tends to lead to higher consumer spending in the US where the US consumers may take on a similar pre-pandemic role of the “global consumer” for goods and services.
Q2 2023 earnings reporting season in the US will go full fledge in around two weeks. Based on FactSet data as of 30 June 2023, its estimated earnings decline compiled from analysts for the S&P 500 is at -6.8% year-on-year, a further drop from Q1’s -2% y/y.
The key will be the number of positive earnings forward guidance from the cyclical sectors such as Industrials and Consumer Discretionary to take over the baton from Information Technology. So far, there is more positive earnings guidance for FY 2023/2024 in Industrials as the mix is 65% positive and 35% negative whereas else Consumer Discretionary share of positive guidance is only 48% (52% negative).
Higher cost of funding and a deeply inverted US Treasury yield curve are key hurdles for the bulls
The bond market seems to be not “buying” into the H1 2023 bullish narrative seen in the stock market. On the last trading day of H1, the US Treasury yield curve spread (10-year minus 2-year) continued to invert deeply to -1.06%, its lowest level since March during the onset of the US regional banking turmoil which indicates an increase odd of a hard landing in the US economy coupled with a higher level of interest rates environment for a longer period that can drive up the cost of leverage and borrowings for corporates and depress profit margins.
If such a scenario materializes, current lofty bullish expectations in the US stock market may see a swift downward adjustment that is at risk of spreading to the rest of the world, and to prevent such occurrences, perhaps China needs to implement more aggressive expansionary monetary and fiscal policies to fill up the liquidity punchbowl given that inflationary pressures are benign in China.
Content is for general information purposes only. It is not investment advice or a solution to buy or sell securities. Opinions are the authors; not necessarily that of OANDA Business Information & Services, Inc. or any of its affiliates, subsidiaries, officers or directors. If you would like to reproduce or redistribute any of the content found on MarketPulse, an award winning forex, commodities and global indices analysis and news site service produced by OANDA Business Information & Services, Inc., please access the RSS feed or contact us at [email protected]. Visit https://www.marketpulse.com/ to find out more about the beat of the global markets. © 2023 OANDA Business Information & Services Inc.
Latest posts by Kelvin Wong (see all)
- SEO Powered Content & PR Distribution. Get Amplified Today.
- PlatoData.Network Vertical Generative Ai. Empower Yourself. Access Here.
- PlatoAiStream. Web3 Intelligence. Knowledge Amplified. Access Here.
- PlatoESG. Automotive / EVs, Carbon, CleanTech, Energy, Environment, Solar, Waste Management. Access Here.
- BlockOffsets. Modernizing Environmental Offset Ownership. Access Here.
- Source: https://www.marketpulse.com/indices/the-great-divergence-between-the-real-economy-and-global-equities/kwong

