- Stellar lumen price is struggling below the $0.120 resistance zone against the US Dollar.
- XLM price is now trading below $0.1185 and the 55 simple moving average (4 hours).
- There is a key bearish trend line forming with resistance near $0.1182 on the 4-hour chart (data feed via Kraken).
- The pair could start a fresh increase if it clears the $0.125 resistance.
Stellar lumen price is trading below $0.120 against the US Dollar, like Bitcoin. XLM price could extend losses if it trades below the $0.115 support.
Stellar Lumen Price Analysis (XLM to USD)
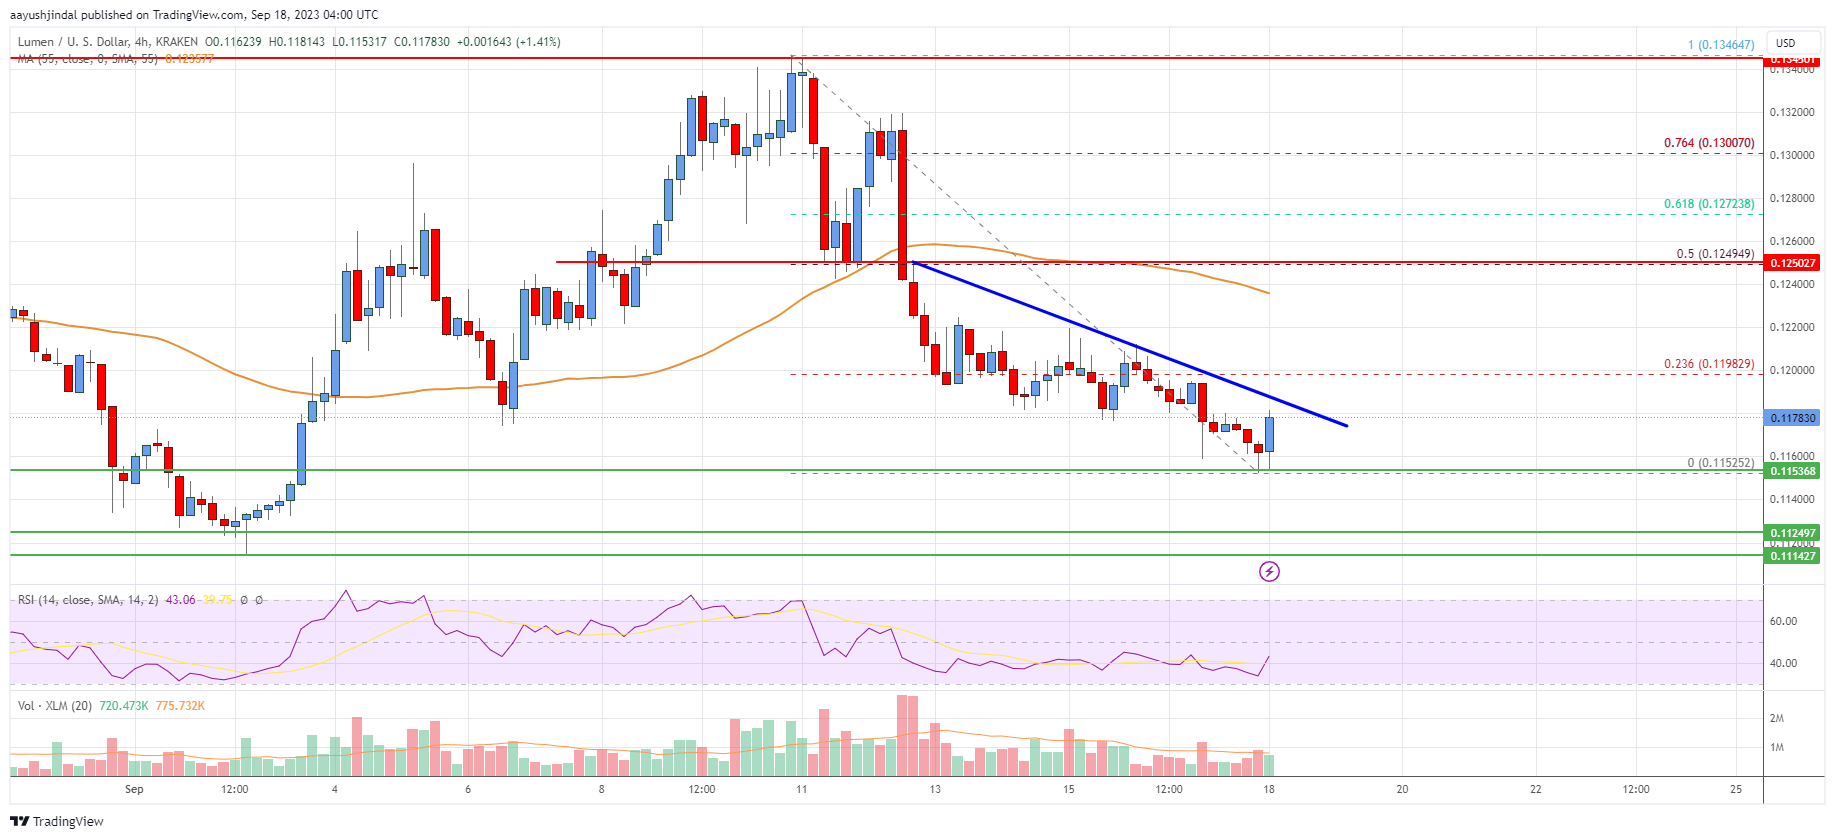
After a decent increase, Stellar Lumen price faced resistance near the $0.135 zone against the US Dollar. The XLM/USD pair failed to continue higher and started a fresh decline.
There was a move below the $0.125 and $0.120 levels. The price tested the $0.1150 zone. A low is formed near $0.1152 and the price is now consolidating losses. XLM is now trading below $0.1185 and the 55 simple moving average (4 hours).
Immediate resistance is near the $0.1182 level. There is also a key bearish trend line forming with resistance near $0.1182 on the 4-hour chart. The next key resistance is seen near the $0.120 level. It is close to the 23.6% Fib retracement level of the downward move from the $0.1346 swing high to the $0.1152 low.
A clear upside break above the $0.120 zone might send the price toward $0.125 or the 50% Fib retracement level of the downward move from the $0.1346 swing high to the $0.1152 low.
Any more gains could lead the price toward the $0.130 level. If not, the price might continue to move down. Initial support on the downside is near the $0.1150 level. The next major support is near the $0.1125. Any more losses could lead the price toward the $0.108 level in the near term, below which the price might even retest $0.1050. The next major support is near $0.100.
The chart indicates that XLM price is now trading below $0.120 and the 55 simple moving average (4 hours). Overall, the price could start a fresh increase if it clears the $0.125 resistance.
Technical Indicators
4 hours MACD – The MACD for XLM/USD is gaining momentum in the bearish zone.
4 hours RSI – The RSI for XLM/USD is now below the 50 level.
Key Support Levels – $0.115 and $0.1125.
Key Resistance Levels – $0.120, $0.125, and $0.130.
- SEO Powered Content & PR Distribution. Get Amplified Today.
- PlatoData.Network Vertical Generative Ai. Empower Yourself. Access Here.
- PlatoAiStream. Web3 Intelligence. Knowledge Amplified. Access Here.
- PlatoESG. Automotive / EVs, Carbon, CleanTech, Energy, Environment, Solar, Waste Management. Access Here.
- PlatoHealth. Biotech and Clinical Trials Intelligence. Access Here.
- ChartPrime. Elevate your Trading Game with ChartPrime. Access Here.
- BlockOffsets. Modernizing Environmental Offset Ownership. Access Here.
- Source: https://www.livebitcoinnews.com/stellar-lumen-xlm-price-revisits-key-support-can-bulls-save-the-day/

