Published 19 hours ago
Solana Price Analysis: The Solana price has remained in a sideways trend for nearly four months now. Amid this consolidation, the traders are strictly following two converging trendlines which project the formation of a bullish flag pattern. This pattern is a well-known bullish continuation pattern that encourages a significant uptrend upon the breakout of its resistance trendline.
advertisement
Key points
- A bullish crossover from the support trendline may trigger a temporary recovery in the SOL price
- A breakdown below the support trendline of the flag pattern will invalidate the bullish thesis
- The 24-hour trading volume in the Solana coin is $480 Million, indicating a 95.4% gain.
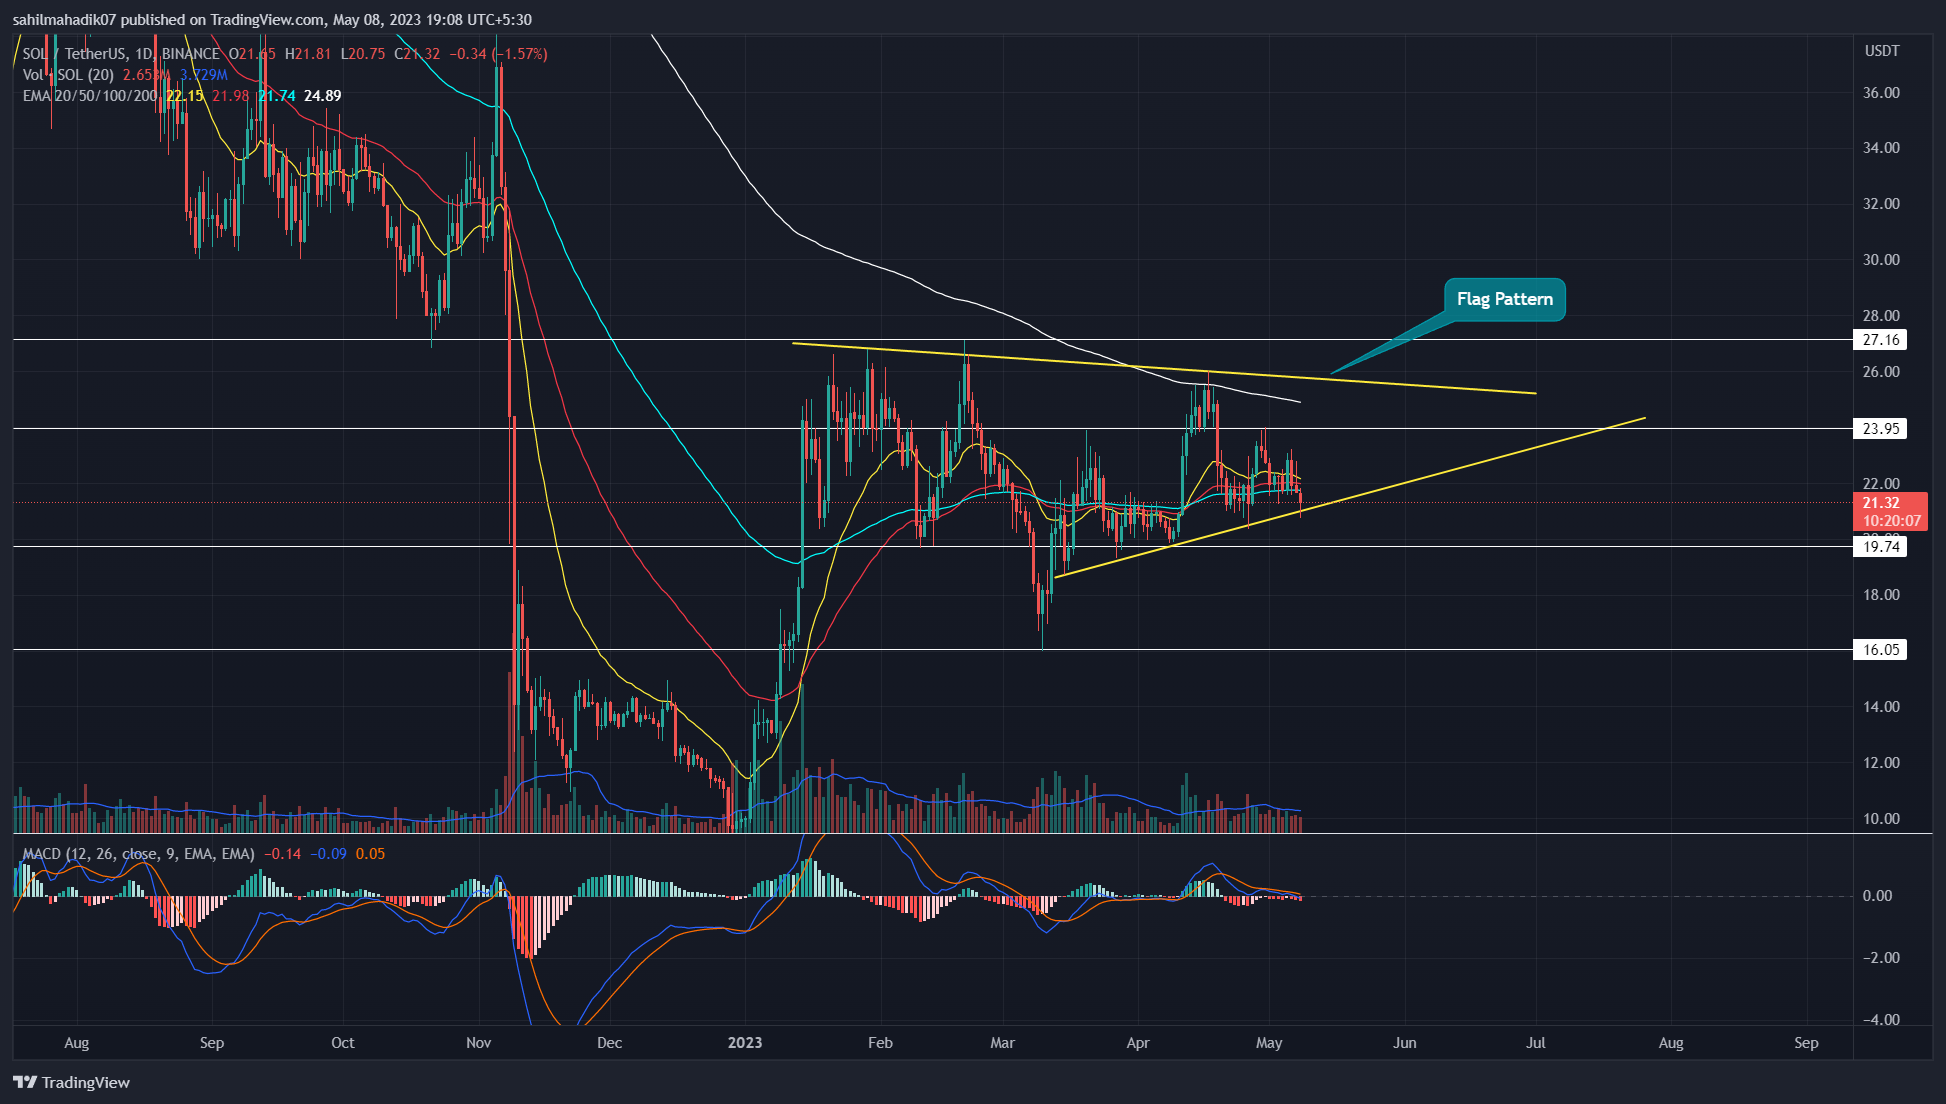
Source-Tradingview
By the press time, the Solana price trades at the $21.26 mark, and with an intraday loss of 2% it retest the support trendline of a flag pattern. The lower price rejection observed in the daily candle reflects the buyers’ continued to defend this support which reflects a possibility of a bullish reversal.
This reversal may trigger a bull cycle within the pattern which encourages a rally to the overhead trendline. Thus, if the buying momentum persists, the Solana price may be nearly 20% of the flag pattern’s resistance trendline.
Trending Stories
Also read: Top Web 3 Phones And Their Specifications
Anyhow, until both the aforementioned trendlines are intact the coin holders may witness a sideways.
However, the most common outcome of the flag pattern is a continuation of the prevailing trendline, and therefore interested traders must for a resistance trendline breakout to witness a sustained rally.
A potential target from the flag pattern completion could be the $40 mark.
Technical indicator
Moving Average Convergence Divergence: Multiple crossovers between the MACD(blue) and signal(orange) accentuate the sideways trend in Solana
Exponential Moving Average:: The 200-day EMA slope wavering around the pattern’s resistance trendline increases the resistance power near this level.
Solana Coin Price Intraday Level
- Spot price: $21.34
- Trend: Bearish
- Volatility: High
- Resistance levels: $23.9 and $27
- Support levels: $21.2 and $20-19.8
Share this article on:
advertisement
The presented content may include the personal opinion of the author and is subject to market condition. Do your market research before investing in cryptocurrencies. The author or the publication does not hold any responsibility for your personal financial loss.
<!– Close Story–>
- SEO Powered Content & PR Distribution. Get Amplified Today.
- PlatoAiStream. Web3 Data Intelligence. Knowledge Amplified. Access Here.
- Minting the Future w Adryenn Ashley. Access Here.
- Buy and Sell Shares in PRE-IPO Companies with PREIPO®. Access Here.
- Source: https://coingape.com/markets/solana-price-analysis-sol-price-is-trapped-in-consolidation-but-the-big-remains-bullish/

