Published 2 mins ago
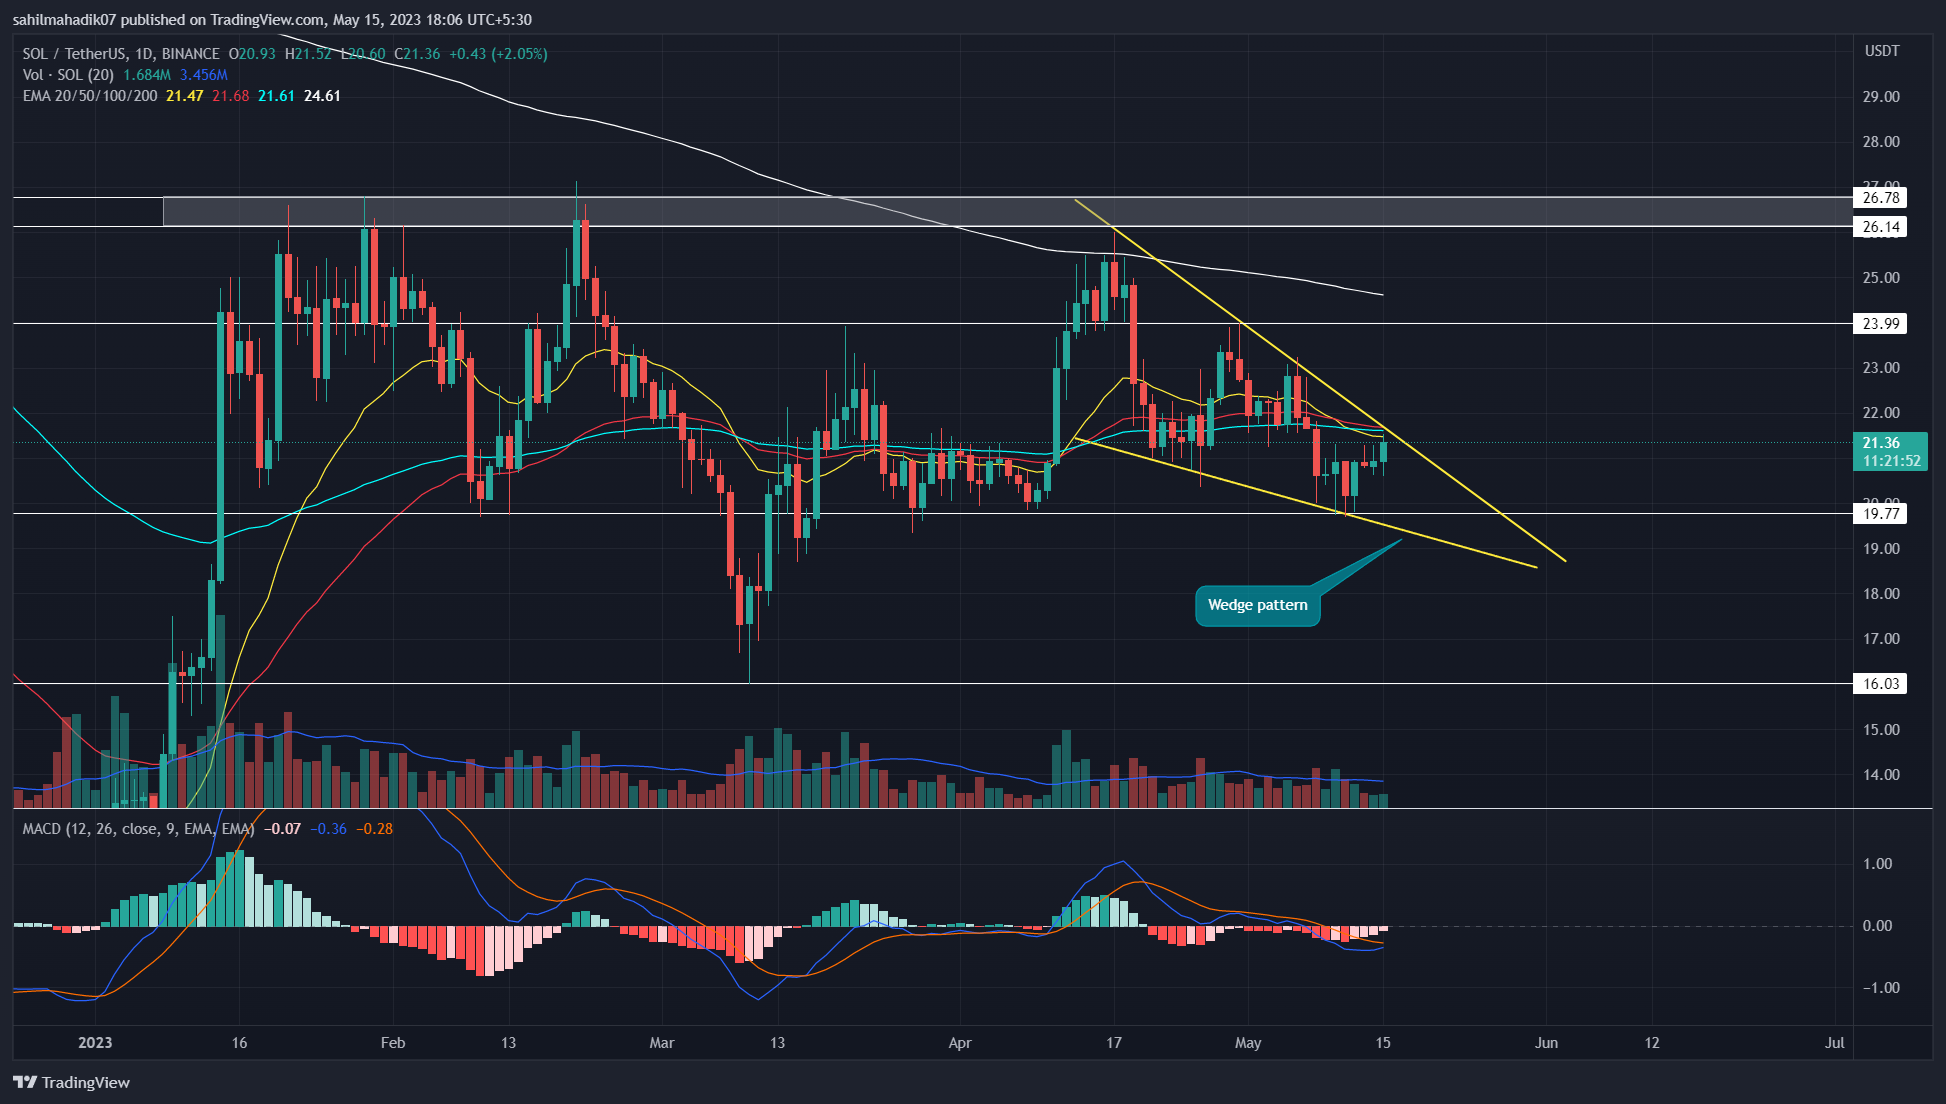
Solana Price Analysis: On May 12th, the Solana price rebounded from the $19.7 support with a famous bullish reversal candle pattern called the tweezer bottom. This reversal candle surged the prices by 8.5% in the last four days, where it will hit the resistance trendline of a falling wedge pattern. This pattern is responsible for prolonging the ongoing correction in SOL price. Here’s how this pattern may encourage a recovery rally in this altcoin.
advertisement
Key points
- Completion of the falling wedge pattern may trigger a fresh recovery cycle in Solana price
- The bullish breakout from the pattern’s resistance trendline will offer an entry opportunity to traders.
- The 24-hour trading volume in the Solana coin is $250.7 Million, indicating a 22.2% gain.
Source-Tradingview
For nearly a month, the Solana price has been in a correction phase under the influence of a falling wedge pattern. This pattern is one of the famous bullish reversal setups that intensify the underlying buying pressure once the price breaches the overhead trendline.
The coin price rebounded from the pattern’s support trendline several times reflecting the trader’s respect for this setup and a higher possibility of it reaching its potential target. With an intraday gain of 1.77%, the Solana price trades at $21.29 and challenges the upper band of the wedge pattern.
Trending Stories
A reversal from this resistance will tumble the prices by 10% to revisit the lower trendline.
Also Read: Top 10 New Meme Coins With The Best Potential In 2023
On a contrary note, a possible breakout with a daily candle closing from the resistance trendline will offer buyers a suitable launchpad to jump back to a higher level. If the bullish momentum persists, the coin price may rise to a $24 or $26 barrier.
Technical indicator
Moving Average Convergence/Divergence: Along with the overhead trendline breakout, the buyers may get an additional confirmation for a long opportunity with the bullish crossover between MACD(blue) and the signal(orange)
Exponential Moving Average: The daily EMAs(20, 50, and 100) accumulated near the resistance trendline creates a strong resistance zone that suggests the SOL may face longer correction within the wedge
Solana Coin Price Intraday Level
- Spot price: $21.3
- Trend: Bullish
- Volatility: Medium
- Resistance levels: $24 and $26
- Support levels: $19.7 and $16
Share this article on:
advertisement
The presented content may include the personal opinion of the author and is subject to market condition. Do your market research before investing in cryptocurrencies. The author or the publication does not hold any responsibility for your personal financial loss.
<!– Close Story–>
- SEO Powered Content & PR Distribution. Get Amplified Today.
- PlatoAiStream. Web3 Data Intelligence. Knowledge Amplified. Access Here.
- Minting the Future w Adryenn Ashley. Access Here.
- Buy and Sell Shares in PRE-IPO Companies with PREIPO®. Access Here.
- Source: https://coingape.com/markets/solana-price-analysis-resistances-pressurize-sol-price-for-10-downfall-sell-or-hold/

