Solana rallied above the $65 resistance against the US Dollar. SOL price is now correcting gains and might even slide below the $50 support.
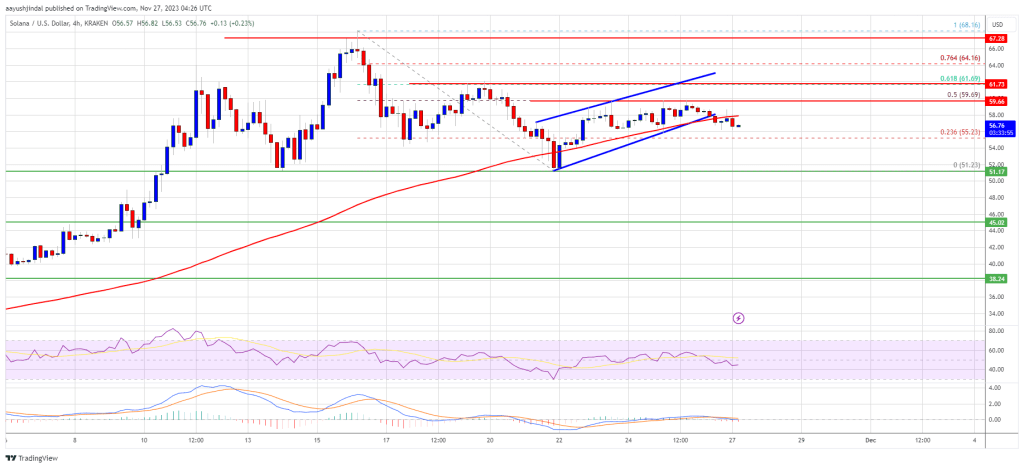
- SOL price started a major rally above the $60 resistance before the bears appeared against the US Dollar.
- The price is now trading below $60 and the 100 simple moving average (4 hours).
- There was a break below a short-term rising channel with support near $58.00 on the 4-hour chart of the SOL/USD pair (data source from Kraken).
- The pair could accelerate lower below the $55.00 support zone in the coming sessions.
Solana Price Starts Downside Correction
In the past few days, Solana saw a major rally above the $60 level. SOL gained bullish momentum after it settled above $60, outperforming Bitcoin and Ethereum.
The bulls even pumped the price above the $65 level. A high was formed near $68.16 and the price recently saw a downside correction. It traded below $60 and tested $52. A low was formed near $51.23 and the price is now consolidating in a range.
There was a break below a short-term rising channel with support near $58.00 on the 4-hour chart of the SOL/USD pair. SOL is now trading below $60 and the 100 simple moving average (4 hours).
On the upside, immediate resistance is near the $59.50 level. It is close to the 50% Fib retracement level of the downward move from the $68.16 swing high to the $51.23 low. The first major resistance is near the $60.00 level.
Source: SOLUSD on TradingView.com
The main resistance is now near $62 or the 61.8% Fib retracement level of the downward move from the $68.16 swing high to the $51.23 low. A successful close above the $62.00 resistance could set the pace for a larger increase. The next key resistance is near $68.50. Any more gains might send the price toward the $72.00 level.
More Losses in SOL?
If SOL fails to recover above the $60.00 resistance, it could continue to move down. Initial support on the downside is near the $55.00 level.
The first major support is near the $51.20 level, below which the price could test $50. If there is a close below the $50 support, the price could decline toward the $45 support in the near term.
Technical Indicators
4-Hours MACD – The MACD for SOL/USD is losing pace in the bullish zone.
4-Hours RSI (Relative Strength Index) – The RSI for SOL/USD is below the 50 level.
Major Support Levels – $55.00, and $51.20.
Major Resistance Levels – $60.00, $62.00, and $68.50.
- SEO Powered Content & PR Distribution. Get Amplified Today.
- PlatoData.Network Vertical Generative Ai. Empower Yourself. Access Here.
- PlatoAiStream. Web3 Intelligence. Knowledge Amplified. Access Here.
- PlatoESG. Carbon, CleanTech, Energy, Environment, Solar, Waste Management. Access Here.
- PlatoHealth. Biotech and Clinical Trials Intelligence. Access Here.
- Source: https://www.newsbtc.com/analysis/sol-price-solana-correction-50/

