
Published 9 hours ago
SHIB Price Analysis: The Shiba Inu price witnessed a sideways trend for the past two months confined between the levels of $0.0000116 and $0.00000975. The consolidation reflected uncertainty among traders as the prices strictly resonated between the aforementioned levels. However, the crypto market witnessed a sudden sell-off today and assisted sellers to breach the lower support of this range. Here’s how you may trade this breakdown.
advertisement
Key Points:
- A bearish breakdown below the $0.00000975 support accelerates the supply pressure in the market.
- The daily EMAs(20, 50, 100, and 200) hint any potential recovery attempt may face multiple resistance in its way
- The intraday trading volume of the Shiba Inu coin is $180.45 Million, showing a 45% gain.
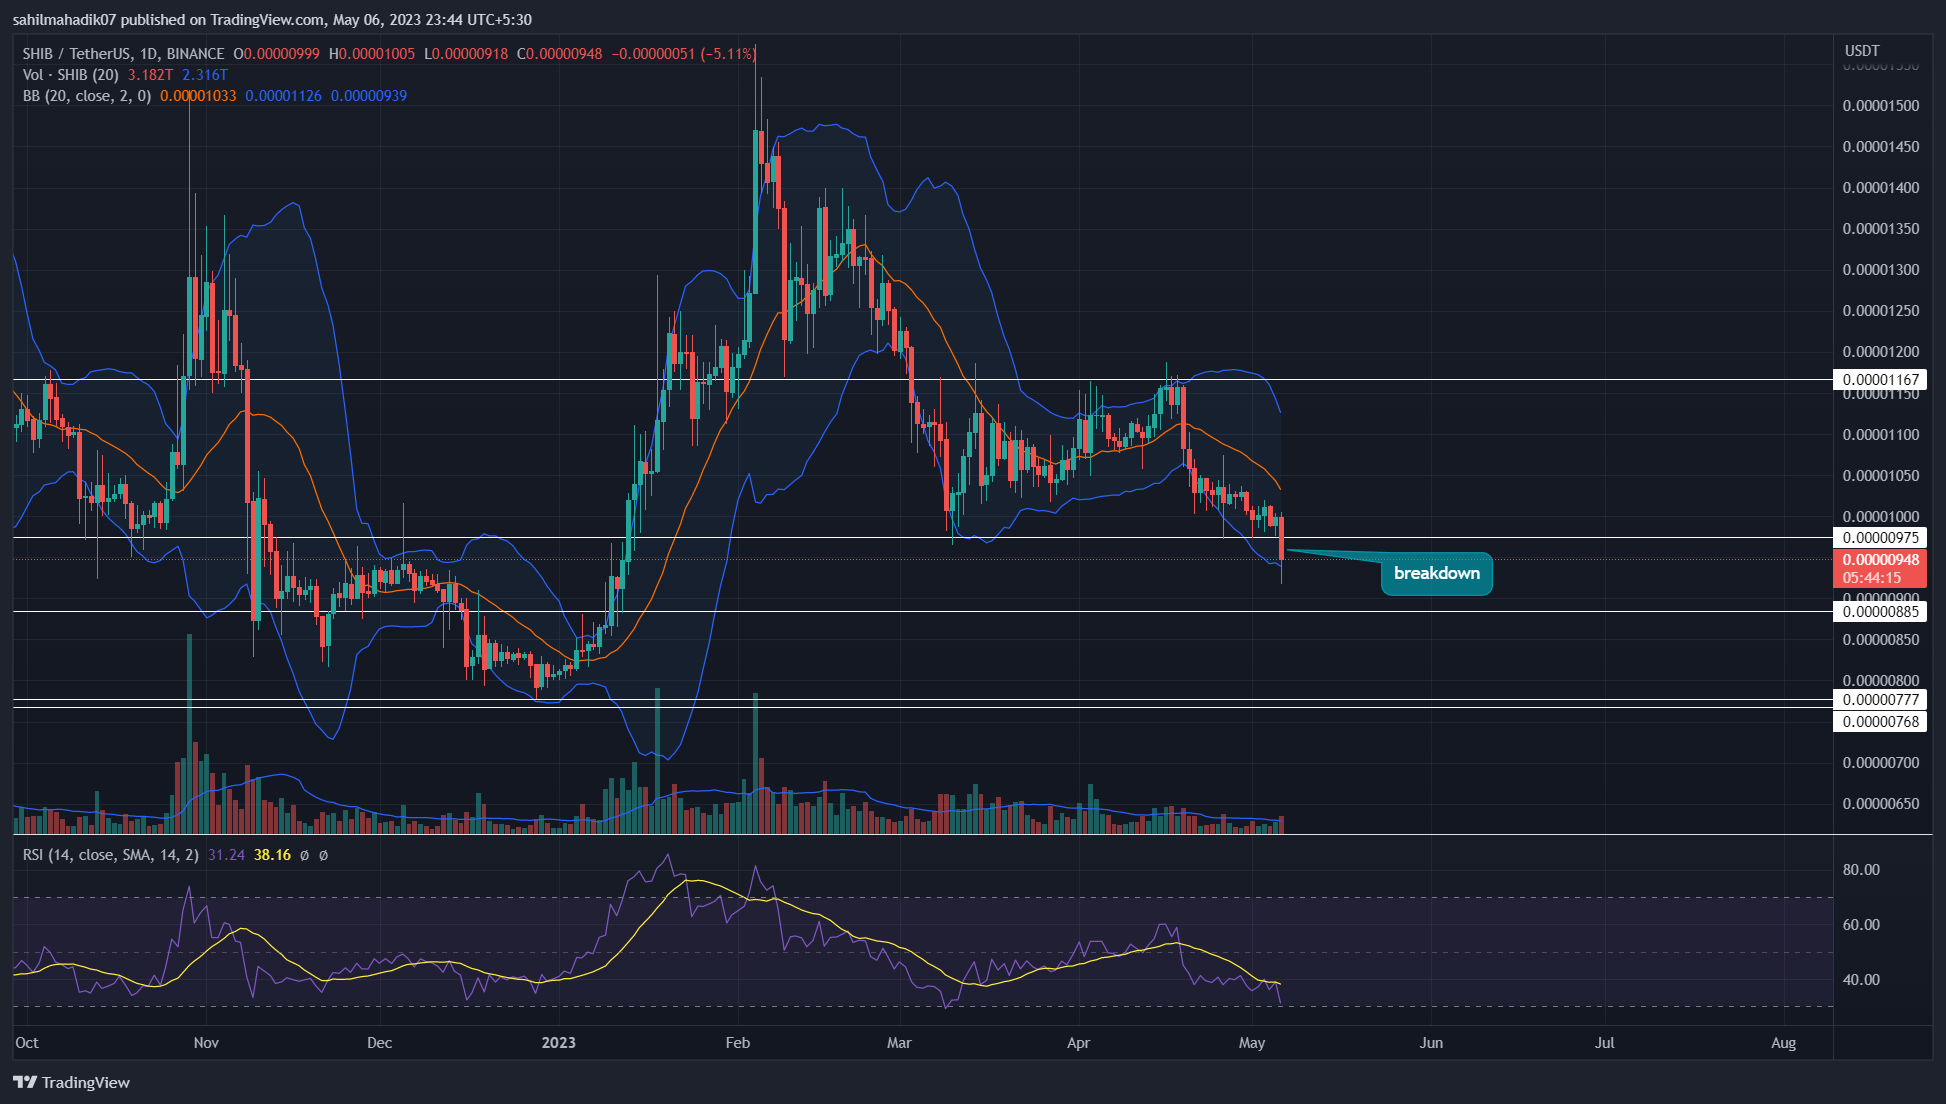
Source- Tradingview
In the daily time frame chart, the Shiba Inu price shows a decisive breakdown from $0.00000975 support of the current range formation. This breakdown backed by the above average volume indicated sellers are confident to plunge this memecoin’s market value lower.
Thus, the pierced support may flip to viable resistance and offer sellers an additional barrier to pressurize buyers. If the daily candle closes below $0.00000975, the interested traders may wait for a bullish pullback to get a better entry opportunity.
Trending Stories
Also Read: Top AI Based Meme Coins List 2023
Furthermore, the potential downfall may plunge the Shiba Inu price 18% down to revisit December 2022 low of $0.00000777.
Technical Indicator
Relative Strength Index: The daily RSI slope dives deeper into the bearish territory reflecting the increased negative sentiment among traders.
Bollinger Band: the coin price falling close to the lower band of the Bollinger Band indicator reflects momentum selling in the market.
Shiba Inu Price Intraday Levels
- Spot price: $0.0000944
- Trend: Bearish
- Volatility: Low
- Resistance levels- $0.0000107 and $0.0000117
- Support levels: $0.00000885 and $0.0000077
Share this article on:
advertisement
The presented content may include the personal opinion of the author and is subject to market condition. Do your market research before investing in cryptocurrencies. The author or the publication does not hold any responsibility for your personal financial loss.
<!– Close Story–>
- SEO Powered Content & PR Distribution. Get Amplified Today.
- PlatoAiStream. Web3 Data Intelligence. Knowledge Amplified. Access Here.
- Minting the Future w Adryenn Ashley. Access Here.
- Buy and Sell Shares in PRE-IPO Companies with PREIPO®. Access Here.
- Source: https://coingape.com/markets/shib-price-analysis-shiba-inu-price-poised-for-18-drop-as-buyers-lose-key-support/

