- Rising geopolitical risk premium may override the historical positive seasonality in the S&P 500 for the months of October and November.
- The US 10-year Treasury yield is now just a stone-throw away from 5.20% and a break above it may spiral towards 6.87% next.
- S&P 500’s market breadth has continued to deteriorate as only 38% of its component stocks are above their respective key 200-day moving averages.
- A bearish breakdown below 4,140 key support on the S&P 500 may trigger a major downtrend phase.
The rally in risk assets such as global equities has started to show signs of wobbliness as the sentiment pendulum swung from over-pessimism in terms of earnings growth at the tail end of 2022 to over-optimism from June this year triggered by the safe haven status of the US mega-cap technology stocks in terms of their respective strong balance sheets reinforced by the artificial intelligence’s (AI) heightened productivity revolution that saw investors and traders bid up aggressively AI-related equities despite their market prices being “richly valued” above their historical mean valuations.
In our previous analysis, we highlighted an impending tactical risk-off scenario in our article, “No summer lull for global equities” published on 7 July 2023 using intermarket analysis such as the record low level of implied correlation among S&P 500 component stocks, the key bullish breakout of the US 10-year Treasury yield above the 3.90% level, and the significant positive gap between the MOVE Index (aggregate US Treasuries’ yield implied volatility) and the CBOE VIX Index (S&P 500 implied volatility). Click here for a recap.
So far, the S&P 500 has staged the expected decline from its medium-term swing high on 27 July to record a decline of -8.50% to print its recent 3 October low of 4,216, similar losses of -8.20% were seen on the Nasdaq 100 and the small-cap Russell 2000 fared the worst that tumbled by -13.70% over the same period.
October and November tend to be positive months for the S&P 500

Fig 1: S&P 500 monthly seasonality performances in the past 20 years as of 18 Oct 2023 (Source: stockcharts.com, click to enlarge chart)
Based on seasonality over the past twenty years, the monthly performances of October and November are generally positive for the main US benchmark stock index, the S&P 500 where these two months recorded an average monthly positive return of 1.1% and 1.8% with a probability of 65% and 74% respectively.
However, given the current uptick in geopolitical risk premium trigged by the current Israel-Hamas conflict that may trigger a further rise in oil prices due to an increasing risk that oil may be used as a “strategic choice of weapon” by respective stakeholders in the Middle East region in any potential “peace negotiation” process.
In the past three years since the pandemic crisis of 2020, WTI crude oil, the US 5 and 10-year breakeven inflation rates (market transacted implied inflationary expectations), and the US 10-year Treasury yield have moved in direct unison.
Watch WTI crude oil that may trigger a further uptick in the US 10-year Treasury yield
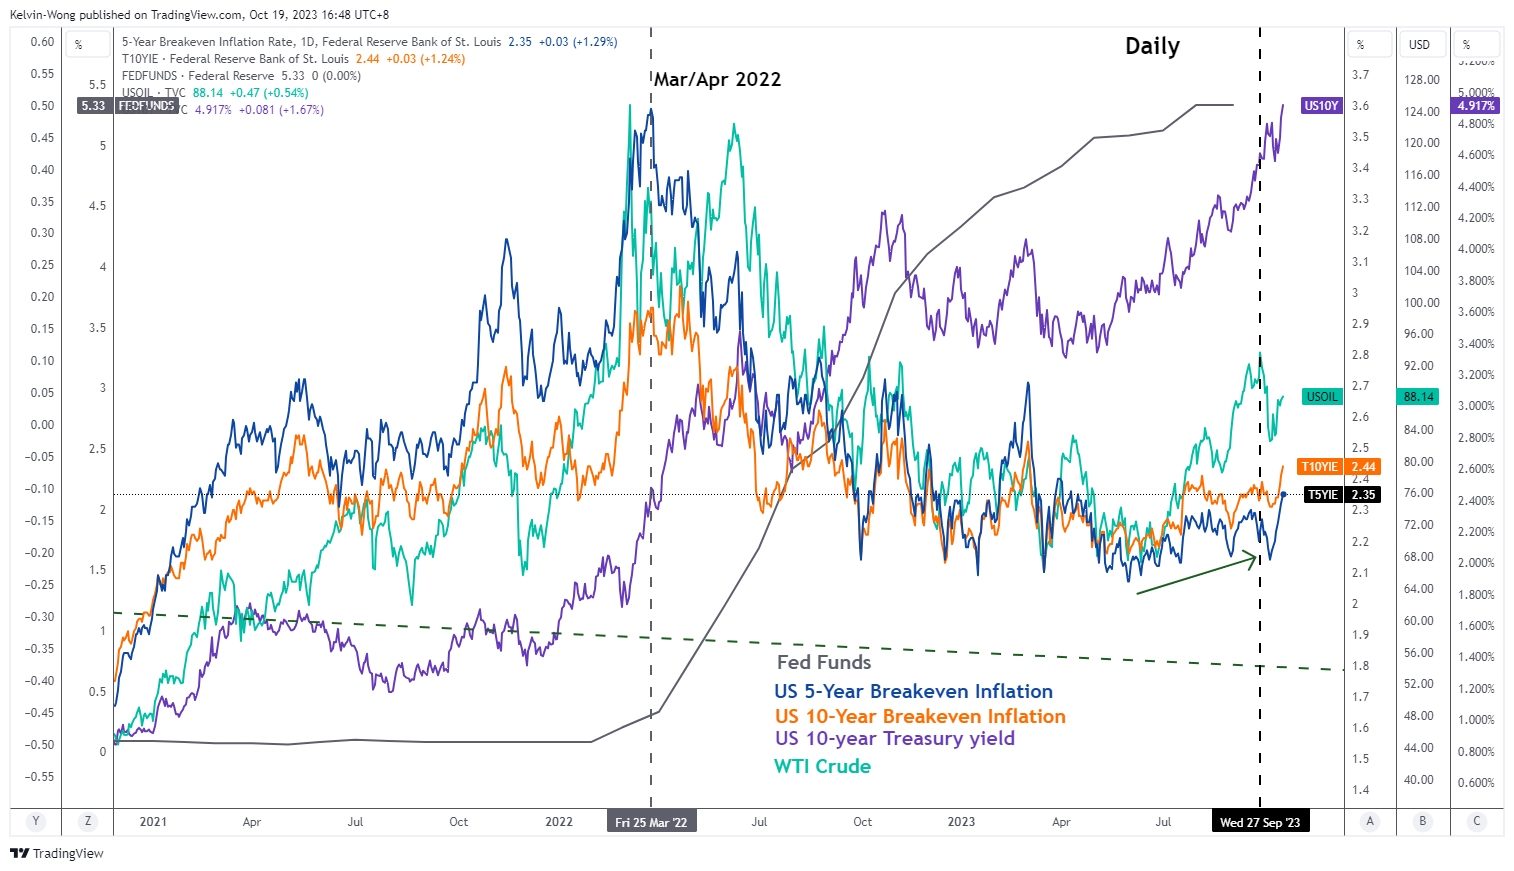
Fig 2: Correlation between WTI crude oil, US 5-year & 10-year breakeven inflation rates, and US 10-year Treasury yield as of 18 Oct 2023 (Source: TradingView, click to enlarge chart)
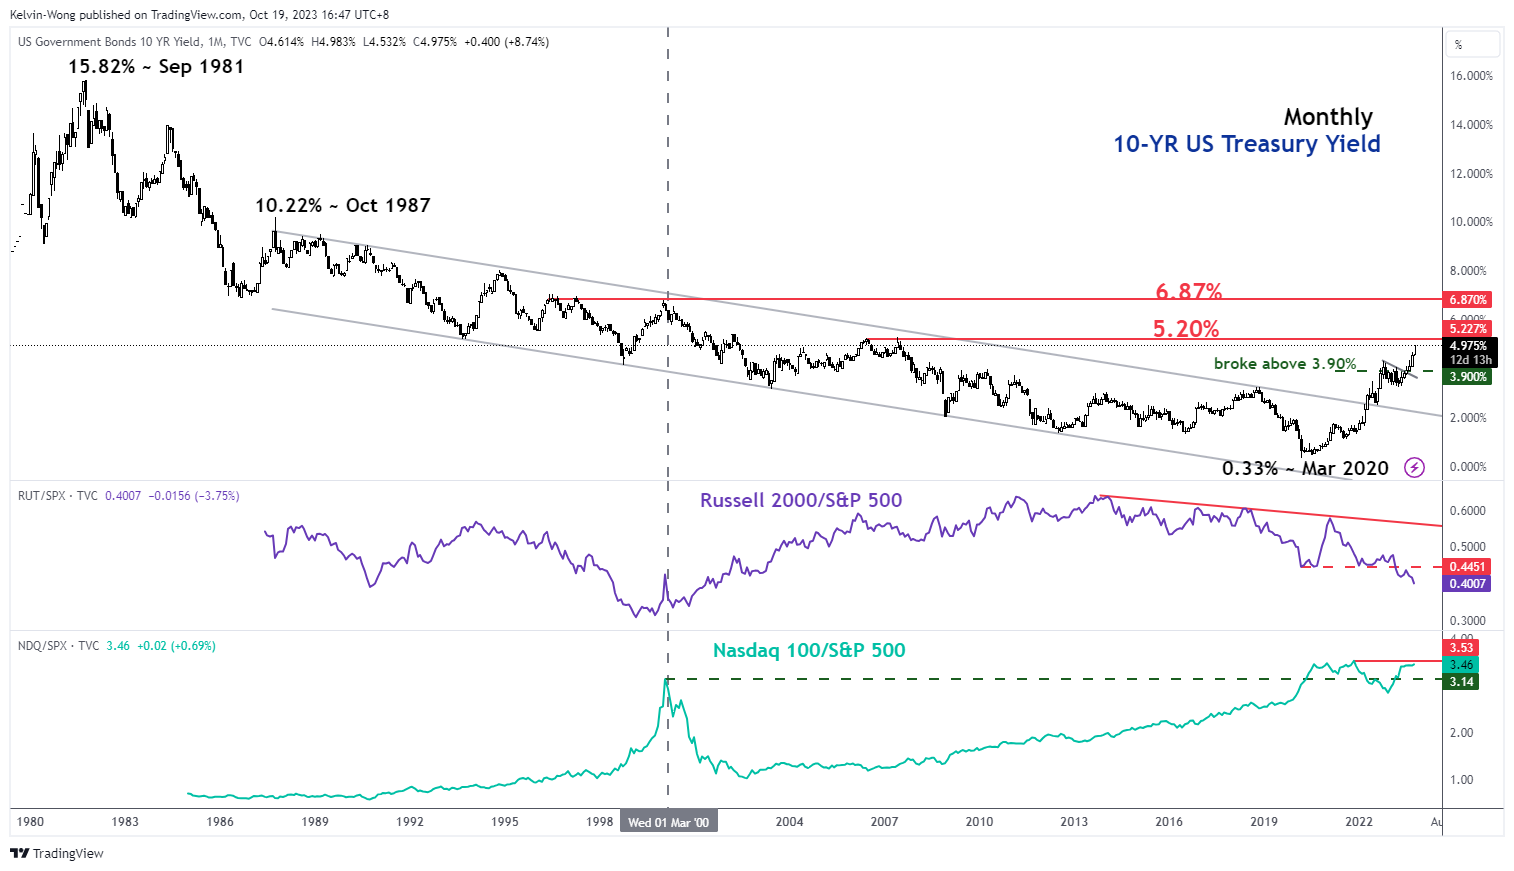
Fig 3: US 10-year US Treasury yield long-term secular trend as of 19 Oct 2023 (Source: TradingView, click to enlarge chart)
Hence, another round of significant impulsive up move sequences in WTI crude oil is likely to trigger a further uptick in the US inflationary expectations above the 2% threshold (the US central bank, Fed’s inflation target) that is likely to reinforce the Fed’s current stance of keeping interest rates at a higher level for a longer period.
Hence, all these chain effects may see further upside movements in the US 10-year Treasury yield where a clearance above 5.20% increases the odds of seeing the next resistance coming in at 6.87% as its long-term secular downtrend from September 1981 to March 2020 is likely to have ended.
Therefore, a higher US 10-year Treasury yield is likely to lead to a higher cost of funding environment. The current 2023 year-to-date high-water mark rally of +20% seen in the S&P 500 has been attributed significantly to the magnificent seven mega-caps (Apple, Amazon, Alphabet, Meta, Microsoft, Tesla & Nvidia) are primarily dependent on longer-term revenues or cash inflows that are likely to be received further far out in the future which in turn tend to have lower present values if discounted by a higher interest rate factor, hence higher opportunity costs for holding such long duration and growth-related mega-cap stocks.
Breadth is getting weaker in the S&P 500
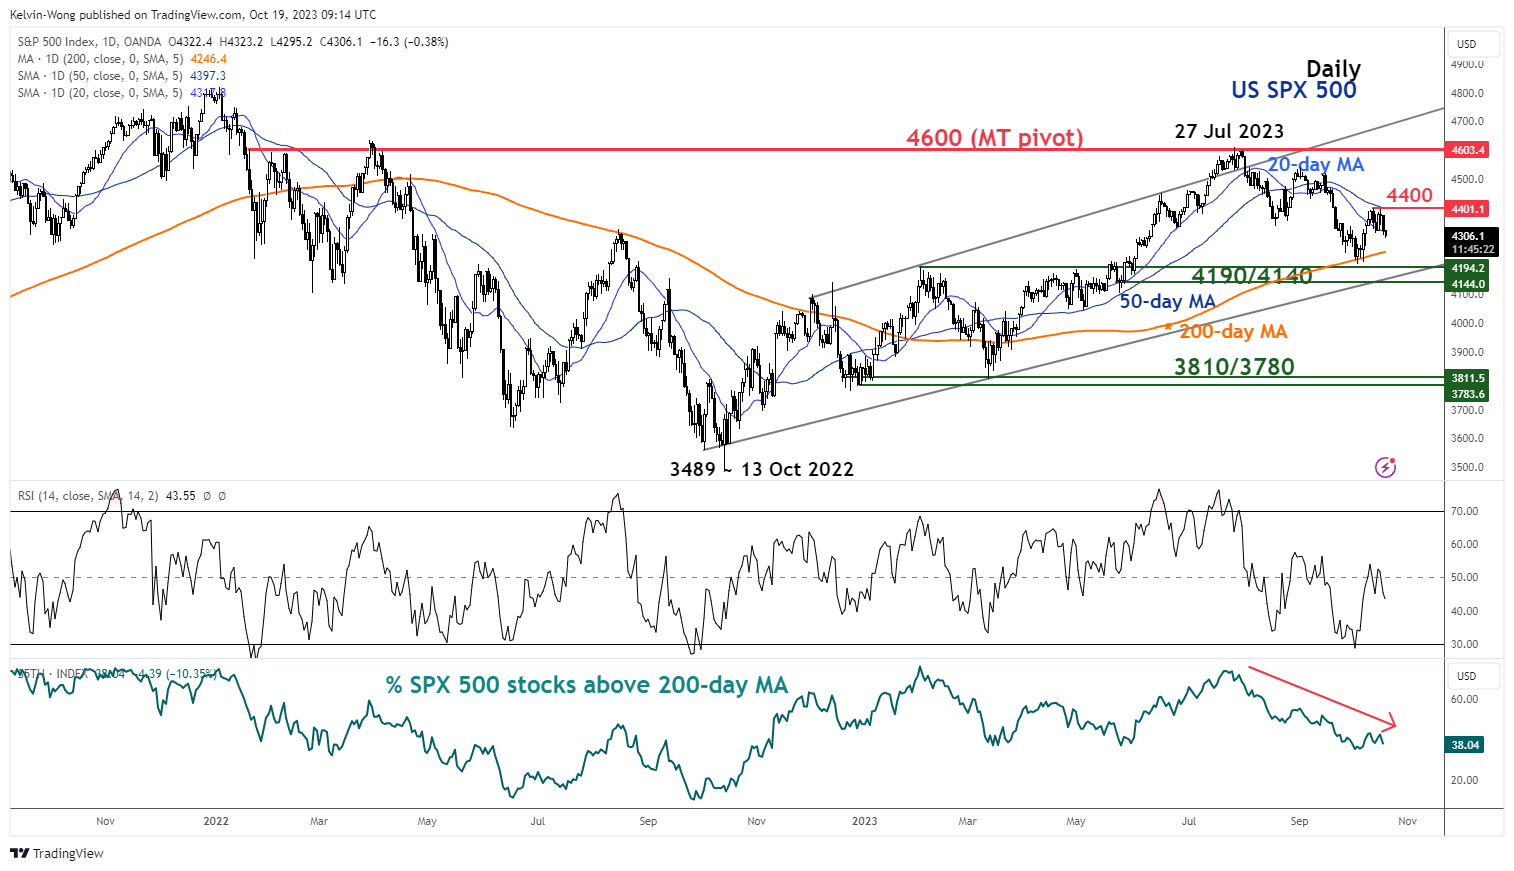
Fig 4: US SPX 500 medium-term trend with market breadth as of 19 Oct 2023 (Source: TradingView, click to enlarge chart)
The current three-month decline in place since the end of July 2023 seen in the S&P 500 has managed to hold above the key 200-day moving average so far but its market breadth is deteriorating.
The number of constituent stocks in the S&P 500 that are above their respective 200-day moving averages is getting lesser by the day, and right now only 38% of the S&P 500 component stocks are still above their 200-day moving averages based on data as of yesterday, 18 October.
This deterioration in market breadth coupled with medium-term and major uptrend phases that are in play for the US 10-year Treasury yield increases the odds of a major bearish breakdown of the S&P 500 below 4,190/4,140 support (ascending trendline from 13 October 2023 low and close to the 200-day moving average).
If such a scenario materializes, the up move of the S&P 500 from the 13 October 2022 low to the recent 27 July 2023 high is likely to be a corrective rally where it kickstarts another potential leg of a multi-month major downtrend phase.
Content is for general information purposes only. It is not investment advice or a solution to buy or sell securities. Opinions are the authors; not necessarily that of OANDA Business Information & Services, Inc. or any of its affiliates, subsidiaries, officers or directors. If you would like to reproduce or redistribute any of the content found on MarketPulse, an award winning forex, commodities and global indices analysis and news site service produced by OANDA Business Information & Services, Inc., please access the RSS feed or contact us at [email protected]. Visit https://www.marketpulse.com/ to find out more about the beat of the global markets. © 2023 OANDA Business Information & Services Inc.
Latest posts by Kelvin Wong (see all)
- SEO Powered Content & PR Distribution. Get Amplified Today.
- PlatoData.Network Vertical Generative Ai. Empower Yourself. Access Here.
- PlatoAiStream. Web3 Intelligence. Knowledge Amplified. Access Here.
- PlatoESG. Carbon, CleanTech, Energy, Environment, Solar, Waste Management. Access Here.
- PlatoHealth. Biotech and Clinical Trials Intelligence. Access Here.
- Source: https://www.marketpulse.com/indices/reality-has-started-to-sink-in-for-richly-valued-us-long-duration-and-growth-equities/kwong

