
 
 
MATIC’s value proposition is gaining popularity as active addresses are steadily increasing and its association with Ethereum paints an optimistic picture.
The surge in active addresses, a key metric reflecting user engagement, has grown by nearly 60% in the last 30 days, reaching 15,708 by March 3rd. This significant increase suggests a growing interest in and adoption of the Polygon network.
The Strong Correlation Between Active Addresses and Price
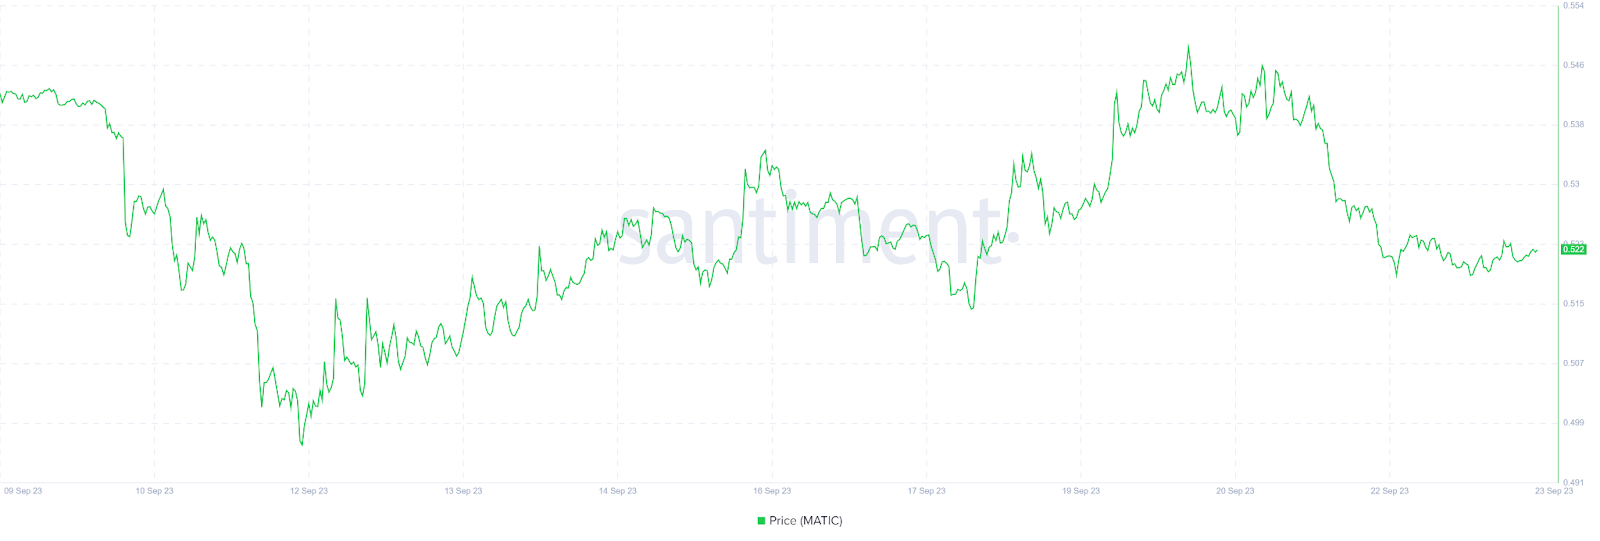
Historical data suggests a strong correlation between the growth in active addresses and the price of MATIC. The surge in active addresses often precedes a period of price stability or a potential price surge.
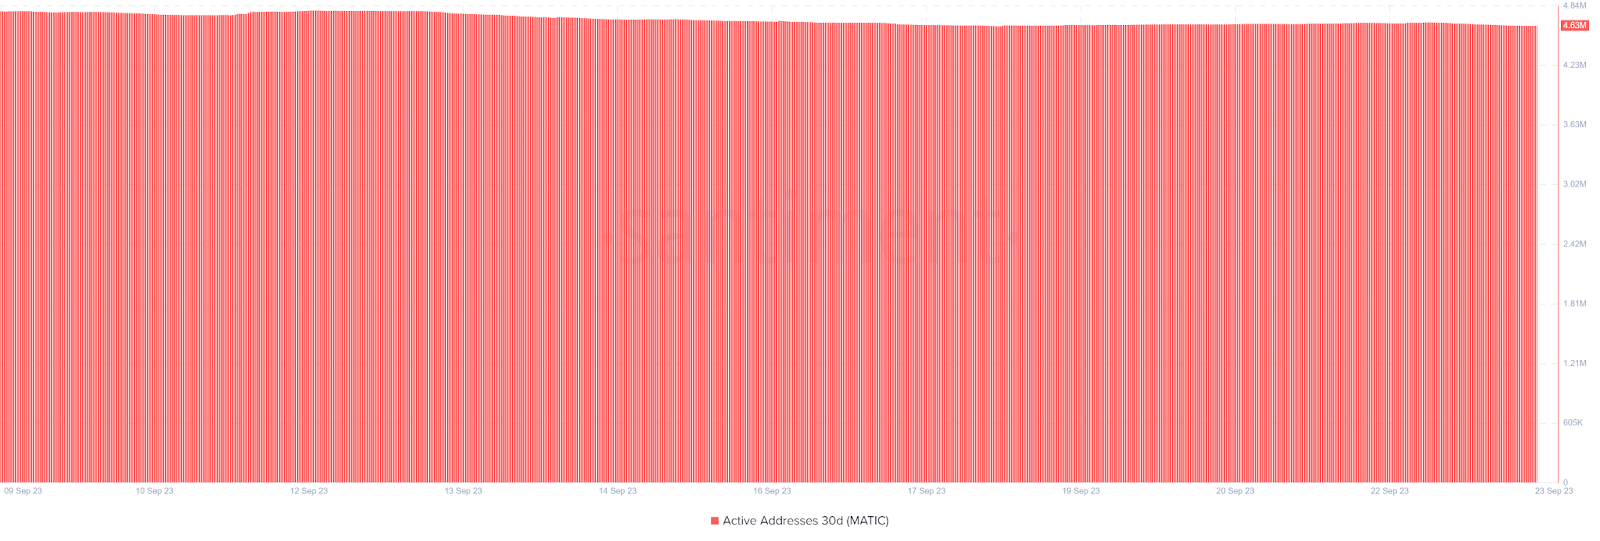
On February 6th, MATIC recorded 10,439 active addresses, which rose to 15,708 by March 3rd. Concurrently, the price of MATIC increased from $0.83 to $1.16, marking a 37.35% growth. This growth in active addresses and prices indicates a positive sentiment and increased activity within the Polygon ecosystem.
Potential for Polygon (MATIC) Price Surge Towards $3 Threshold
The recent surge in active addresses and prices has raised speculation about MATIC’s price trajectory. The close correlation between MATIC’s price and Ethereum’s (ETH) price movements, with a correlation coefficient exceeding 0.8, suggests that MATIC could be on track to reach the $3 threshold.

 
Ethereum’s current upward momentum further supports this speculation, as MATIC tends to closely mirror Ethereum’s price movements.
Despite the positive indicators, MATIC’s price may consolidate or correct in the near future. Past data shows that a pause in the growth of active addresses often precedes a period of price stability or correction.
This pattern suggests that while MATIC’s price has seen significant growth recently, it may undergo a consolidation phase before potentially resuming its upward trend.
MATIC Price Analysis and Prediction
The analysis of the IOMAP chart reveals a notable concentration of addresses “In the Money,” indicating substantial support at lower price levels, particularly around $1.10, where a large number of buyers are situated. Should this support level remain intact, it may serve as a barrier against further downward trends.
If the price surpasses the $1.9 resistance level, it could signify a strong bullish signal. This breakthrough might lead to a further upward movement towards the subsequent resistance levels, approximately at $2.21 and potentially $2.5 or higher.
This shift would be indicated by the red bubbles (representing addresses “Out of the Money”) beyond $1.14 transitioning to green (indicating profitability), thereby alleviating selling pressure.

A bearish trend could be triggered if the price falls below the substantial support levels, particularly if it drops beneath the huge green bubble, ranging from $1.10 to $1.14. Breaching such a crucial support level may erode confidence and potentially induce a sell-off.
- SEO Powered Content & PR Distribution. Get Amplified Today.
- PlatoData.Network Vertical Generative Ai. Empower Yourself. Access Here.
- PlatoAiStream. Web3 Intelligence. Knowledge Amplified. Access Here.
- PlatoESG. Carbon, CleanTech, Energy, Environment, Solar, Waste Management. Access Here.
- PlatoHealth. Biotech and Clinical Trials Intelligence. Access Here.
- Source: https://zycrypto.com/polygon-active-addresses-surge-60-in-30-days-3-matic-all-time-high-milestone-in-sight/

