- Medium-term uptrend phase from 26 October 2023 remains intact.
- 6240 is the potential bullish inflection level.
- Hourly RSI has flashed a bullish momentum breakout condition.
The Kiwi (NZD/USD) has been oscillating within a medium-term uptrend phase in place since 26 October 2023 low of 0.5774. So far, it has rallied by +596 pips/+10.3% to print a recent intraday high of 0.6370 on 28 December 2023.
There were two prior minor pullbacks seen within this ongoing medium-term uptrend; 3 November 2023 to 14 November 2023 (-143 pips/-2.4%), and 4 December 2023 to 13 December 2023 (-138 pips/-2.2%). The latest pullback in price actions from the 28 December high to today, 3 January current intraday low of 0.6245 at this time of the writing is slightly lesser in magnitude (-124 pips/-1.95%) versus the prior pullbacks.
Potential start of new bullish impulsive upmove
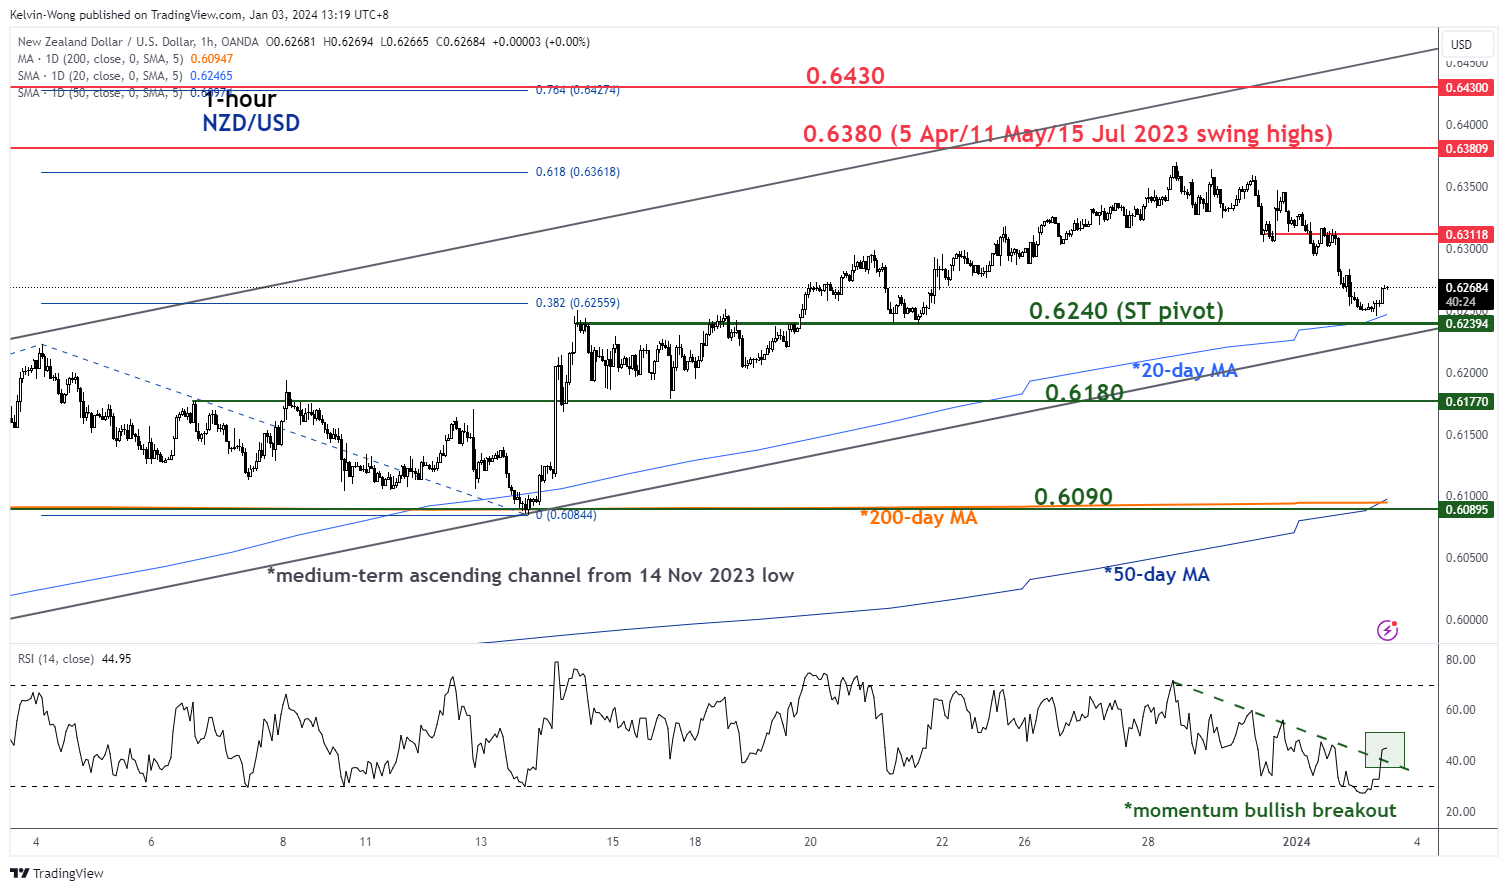
Fig 1: NZD/USD minor short-term trend as of 2 Jan 2024 (Source: TradingView, click to enlarge chart)
Interestingly, the current pullback has stalled right at the potential bullish inflection zone; the 20-day upward-sloping moving average, the lower boundary of a medium-term ascending channel in place since 14 November 2023 low, and the 23.6% Fibonacci retracement of the medium-term uptrend phase from 26 October 2023 low to 28 December 2023 high).
In addition, the hourly RSI momentum indicator has just staged a momentum bullish breakout after it dipped into its oversold region during yesterday, 2 January US session.
All in all, this set of positive technical elements suggests that the current slide seen in NZD/USD from its 28 December 2023 high of 0.6370 may have hit a potential tipping point where its price actions may kickstart another bullish impulsive upmove sequence to resume its medium-term uptrend trajectory.
Watch the 0.6240 key short-term pivotal support and clearance above 0.6310 sees the next intermediate resistances coming in at 0.6380 and 0.6430.
On the other hand, failure to hold at 0.6240 invalidates the bullish scenario for an extension of the corrective pullback to expose the next intermediate supports at 0.6180 and 0.6090 (also the 50 & 200-day moving averages).
Content is for general information purposes only. It is not investment advice or a solution to buy or sell securities. Opinions are the authors; not necessarily that of OANDA Business Information & Services, Inc. or any of its affiliates, subsidiaries, officers or directors. If you would like to reproduce or redistribute any of the content found on MarketPulse, an award winning forex, commodities and global indices analysis and news site service produced by OANDA Business Information & Services, Inc., please access the RSS feed or contact us at [email protected]. Visit https://www.marketpulse.com/ to find out more about the beat of the global markets. © 2023 OANDA Business Information & Services Inc.
Latest posts by Kelvin Wong (see all)
- SEO Powered Content & PR Distribution. Get Amplified Today.
- PlatoData.Network Vertical Generative Ai. Empower Yourself. Access Here.
- PlatoAiStream. Web3 Intelligence. Knowledge Amplified. Access Here.
- PlatoESG. Carbon, CleanTech, Energy, Environment, Solar, Waste Management. Access Here.
- PlatoHealth. Biotech and Clinical Trials Intelligence. Access Here.
- Source: https://www.marketpulse.com/forex/nzd-usd-technical-pulled-back-towards-potential-bullish-inflection-zone/kwong

