- Japanese Government Bond (JGB) yields on the upmove ex-post BoJ.
- Positive yield premium shrinkage (JGB over the rest of the world) may put further downside pressure on JPY crosses carry trades.
- Watch NZD/JPY where RBNZ may reduce its hawkish rhetoric reinforced by NZ Q4’s soft inflation data.
This is a follow-up analysis of our prior report, “BoJ poised to offer guidance on the removal of short-term negative rates may spark JPY strength” published on 22 January 2024. Click here for a recap.
Bank of Japan (BoJ) concluded its first monetary policy meeting for 2024 yesterday and left its key short-term negative rate unchanged at -0.1% as expected.
The key takeaway from BoJ is more forceful forward guidance with a hawkish tilt that arose from BoJ Governor Ueda’s press conference where he sounded more confident that BoJ will likely hit its 2% inflation target in the medium to long term, a contrast to his previous remarks in prior press conferences where he had stressed that accommodating ultra-easy monetary policy was still required because of the “unclear path” of inflation trajectory in Japan.
Hence, this latest set of forward guidance from BoJ has sent a signal to the markets that an end to its short-term negative interest rates policy is imminent, high odds are now being priced for the removal of negative interest rates on its April or June meeting, also taking into account that BoJ has allowed the 10-year Japanese Government Bond (JGB) bond yield to move more freely according to market forces after it scrapped the hard-capped 1% upper limit to make it as a “reference level” during last October monetary policy meeting.
JGB yields are moving up
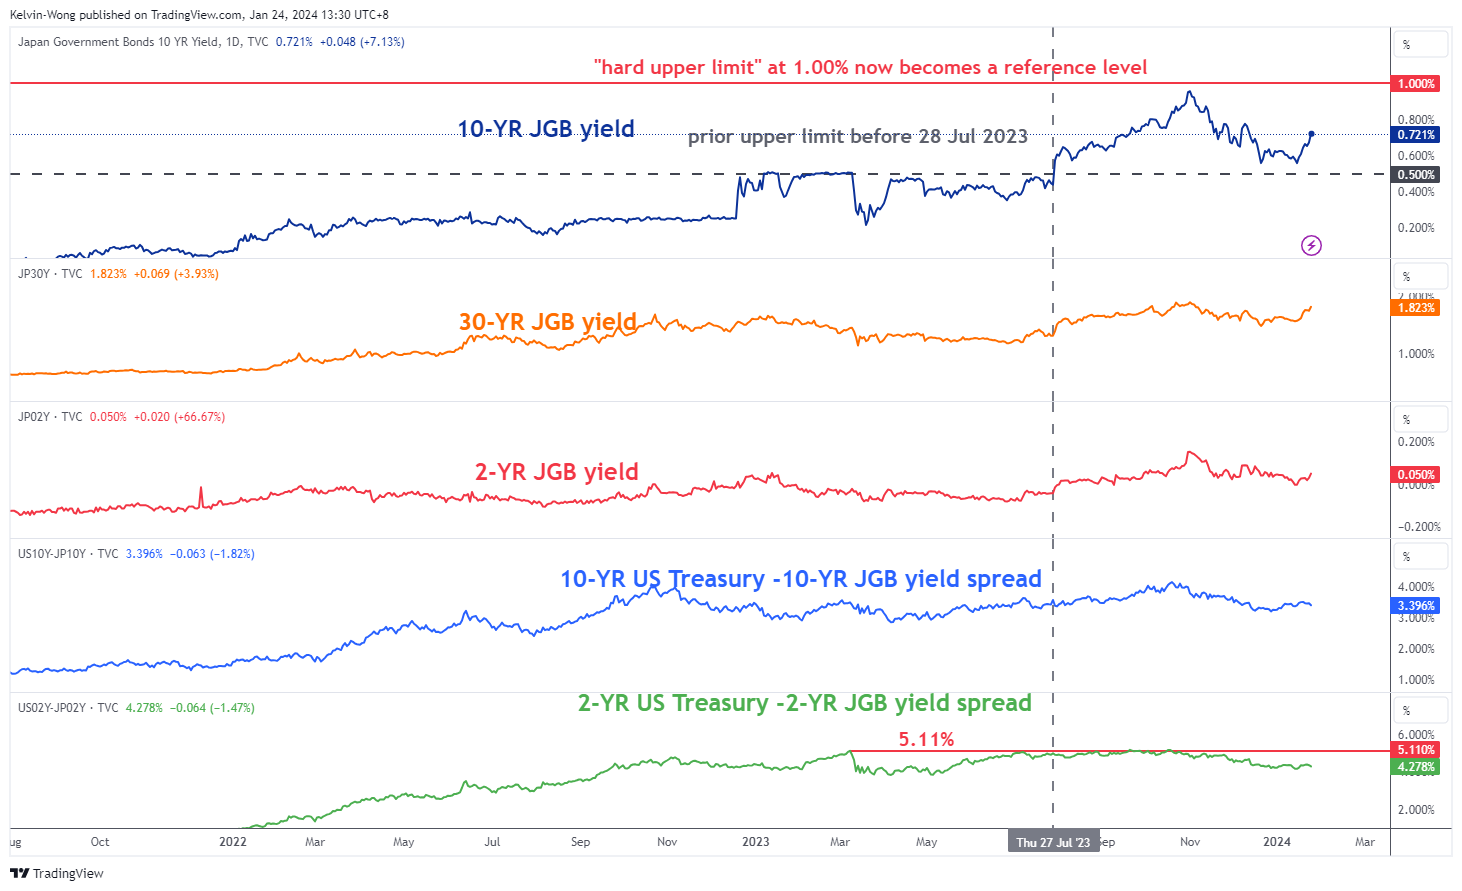
Fig 1: JGB yields medium-term trends as of 24 Jan 2024 (Source: TradingView, click to enlarge chart)
All in all, it has sent the 2-year and 10-year JGB yields rallying where the 10-year JGB yield has ticked up by 16 basis points (bps) from 15 January 2024 to 0.72% at this time of the writing. In addition, the short-end 2-year JGB yield rallied by 5 bps, albeit at a slower pace to 0.05% over the same period (see Fig 1).
JPY crosses carry trades under downside pressure
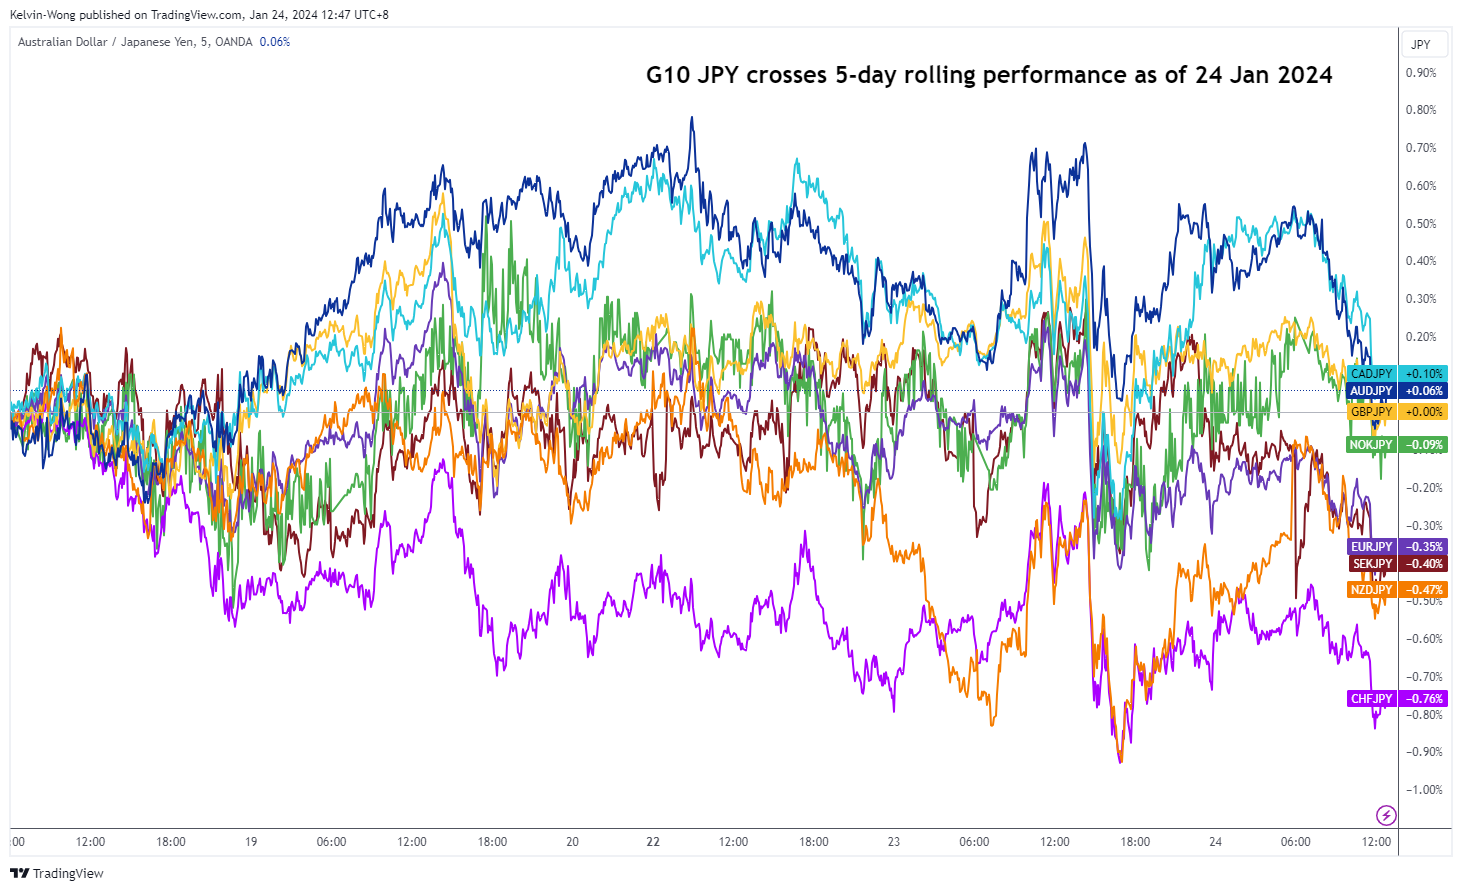
Fig 2: 5-day rolling performances of G-10 JPY crosses as of 24 Jan 2024 (Source: TradingView, click to enlarge chart)
The recent up moves (potentially future rallies due to the anticipated faster pace normalization of BoJ’s current ultra-easy monetary policy) in the JGB yields have reduced the positive carry trade yield premium capture opportunities via using JPY as a funding currency.
Since it is getting more “costly” now to deploy such carry trade set-ups, it has triggered a reflexive negative feedback loop into the price actions of the G-10 JPY crosses and the worst hits were the CHF/JPY (-0.76%), and NZD/JPY (-0.47%) based on a 5-day rolling performance basis at this time of the writing (see Fig 1).
Yield spread premium shrinkage of New Zealand Government Bond
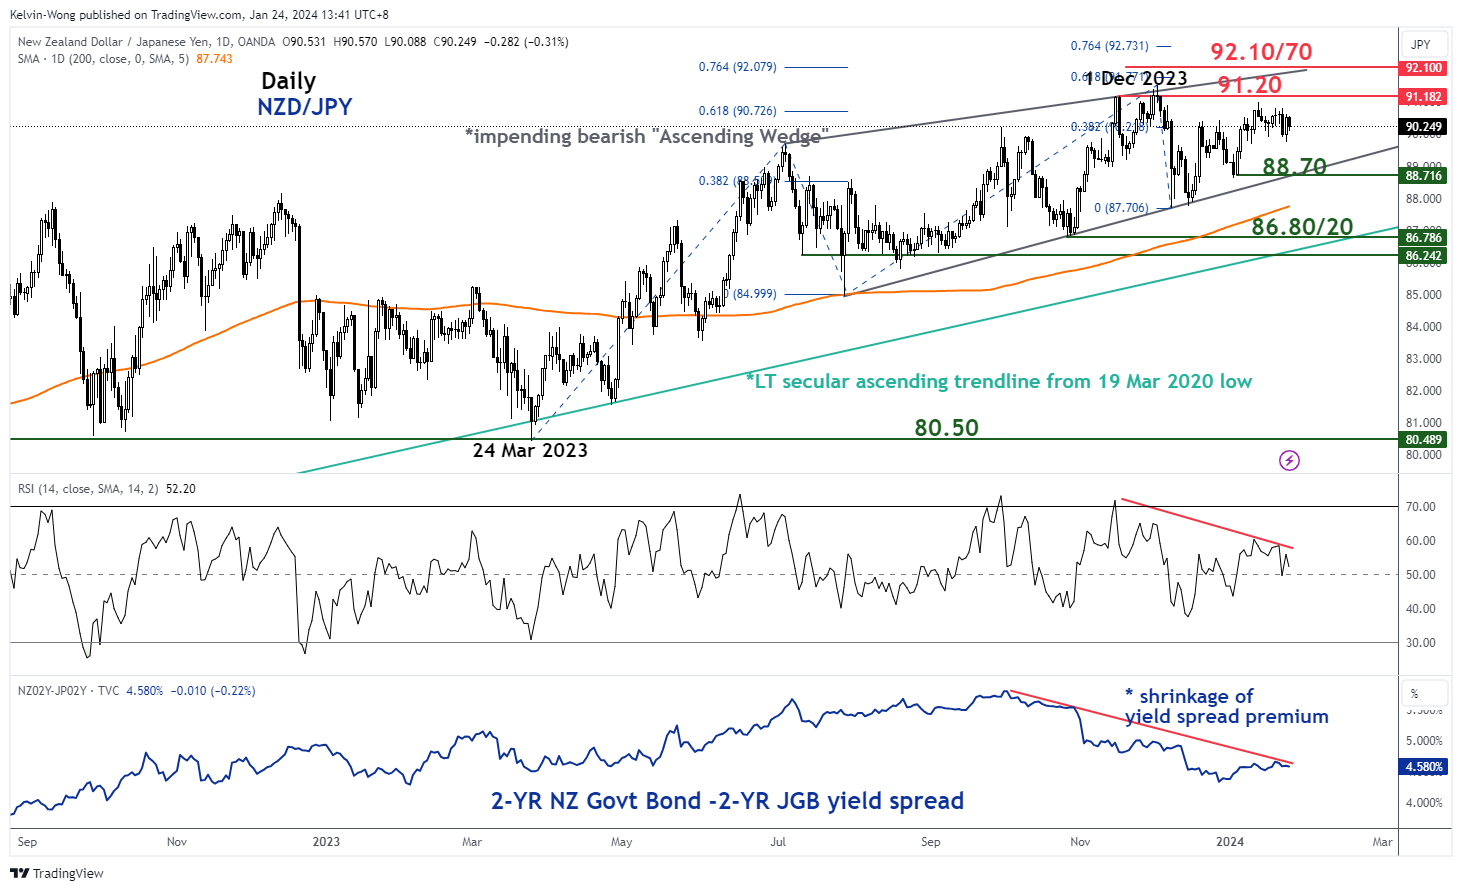
Fig 3: NZD/JPY medium-term trend as of 24 Jan 2024 (Source: TradingView, click to enlarge chart)
The 2-year yield spread premium of the New Zealand Government Bond over JGB has shrunk significantly from a decade-plus high of 5.80% printed recently on 3 October 2023 to 4.58% today (-122 bps) which in turn acts as another potential downside pressure catalyst on the NZD/JPY cross pair.
Also, today’s release of New Zealand’s Q4 2023 inflation rate continued to decelerate to 4.7% y/y from 5.6% y/y in Q3 2023; its lowest reading since Q2 2021 which is likely to reduce the current hawkish rhetoric of New Zealand central bank, RBNZ.
The potential net result; a further slide in the 2-year New Zealand Government Bond yield may be still on the cards (see Fig 3)
In the lens of technical analysis, the long-term secular uptrend phase of the NZD/JPY from its 19 March 2020 swing low may be coming to a terminal end where its price actions have recently traced out an impending multi-month bearish “Ascending Wedge” configuration since 28 July 2023 coupled with a bearish divergence condition seen on its daily RSI momentum indicator.
These observations suggest that NZD/JPY may be evolving into a major toppish configuration where a potential significant multi-month corrective decline could unfold next.
Watch the 90.75 key short-term resistance on NZD/JPY
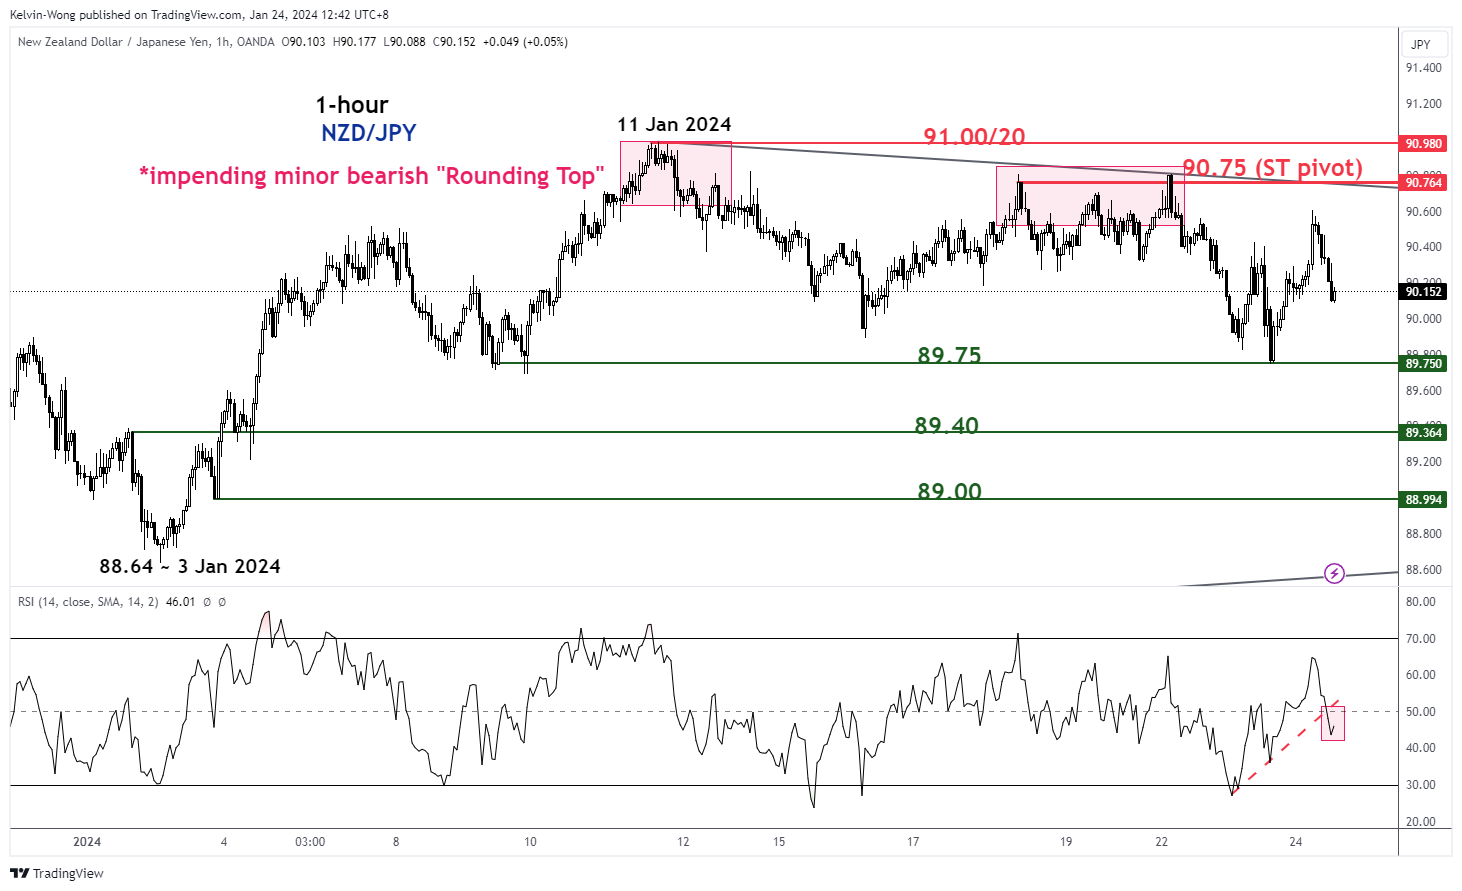
Fig 4: NZD/JPY minor short-term trend as of 24 Jan 2024 (Source: TradingView, click to enlarge chart)
In the short-term as depicted on the hourly chart, the price actions of NZD/JPY are suggesting further potential downside as it traced out a minor bearish “Rounding Top” configuration with a current trendline breakdown of its hourly RSI momentum indicator below the 50 level.
A break below the near-term support of 89.75 (neckline of the minor “Rounding Top”) exposes the next intermediate supports at 89.40 and 89.00.
On the other hand, clearance above the 90.75 key short-term pivotal resistance negates the bearish tone to see the major resistance coming in at 91.00/91.20.
Content is for general information purposes only. It is not investment advice or a solution to buy or sell securities. Opinions are the authors; not necessarily that of OANDA Business Information & Services, Inc. or any of its affiliates, subsidiaries, officers or directors. If you would like to reproduce or redistribute any of the content found on MarketPulse, an award winning forex, commodities and global indices analysis and news site service produced by OANDA Business Information & Services, Inc., please access the RSS feed or contact us at [email protected]. Visit https://www.marketpulse.com/ to find out more about the beat of the global markets. © 2023 OANDA Business Information & Services Inc.
Latest posts by Kelvin Wong (see all)
- SEO Powered Content & PR Distribution. Get Amplified Today.
- PlatoData.Network Vertical Generative Ai. Empower Yourself. Access Here.
- PlatoAiStream. Web3 Intelligence. Knowledge Amplified. Access Here.
- PlatoESG. Carbon, CleanTech, Energy, Environment, Solar, Waste Management. Access Here.
- PlatoHealth. Biotech and Clinical Trials Intelligence. Access Here.
- Source: https://www.marketpulse.com/fundamental/nzd-jpy-jpy-crosses-under-downside-pressure-after-bojs-hawkish-guidance/kwong

