- Bearish reversal candlestick formed yesterday, its steepest daily loss since 27 October 2023.
- Odds now have skewed towards a potential minor corrective decline sequence within a medium-term uptrend phase.
- Watch the 16,800 key short-term resistance.
This is a follow-up analysis of our prior report, “Nasdaq 100: It’s all about liquidity to maintain current bullish momentum” published on 13 December 2023. Click here for a recap.
The price actions of the US Nas 100 Index (a proxy for the Nasdaq 100 futures) have continued to rally and surpassed the 16,590 short-term resistance as highlighted in our previous analysis and the former 16,772 all-time high printed on 22 November 2021.
It continued to inch higher yesterday, 20 December during the first half of the US session where it rallied by +0.3% intraday and printed a fresh all-time high of 16,898. But it could not maintain its initial bullish momentum and reversed down to end the US session with a daily loss of -1.37%
Steepest daily loss since 27 October 2023
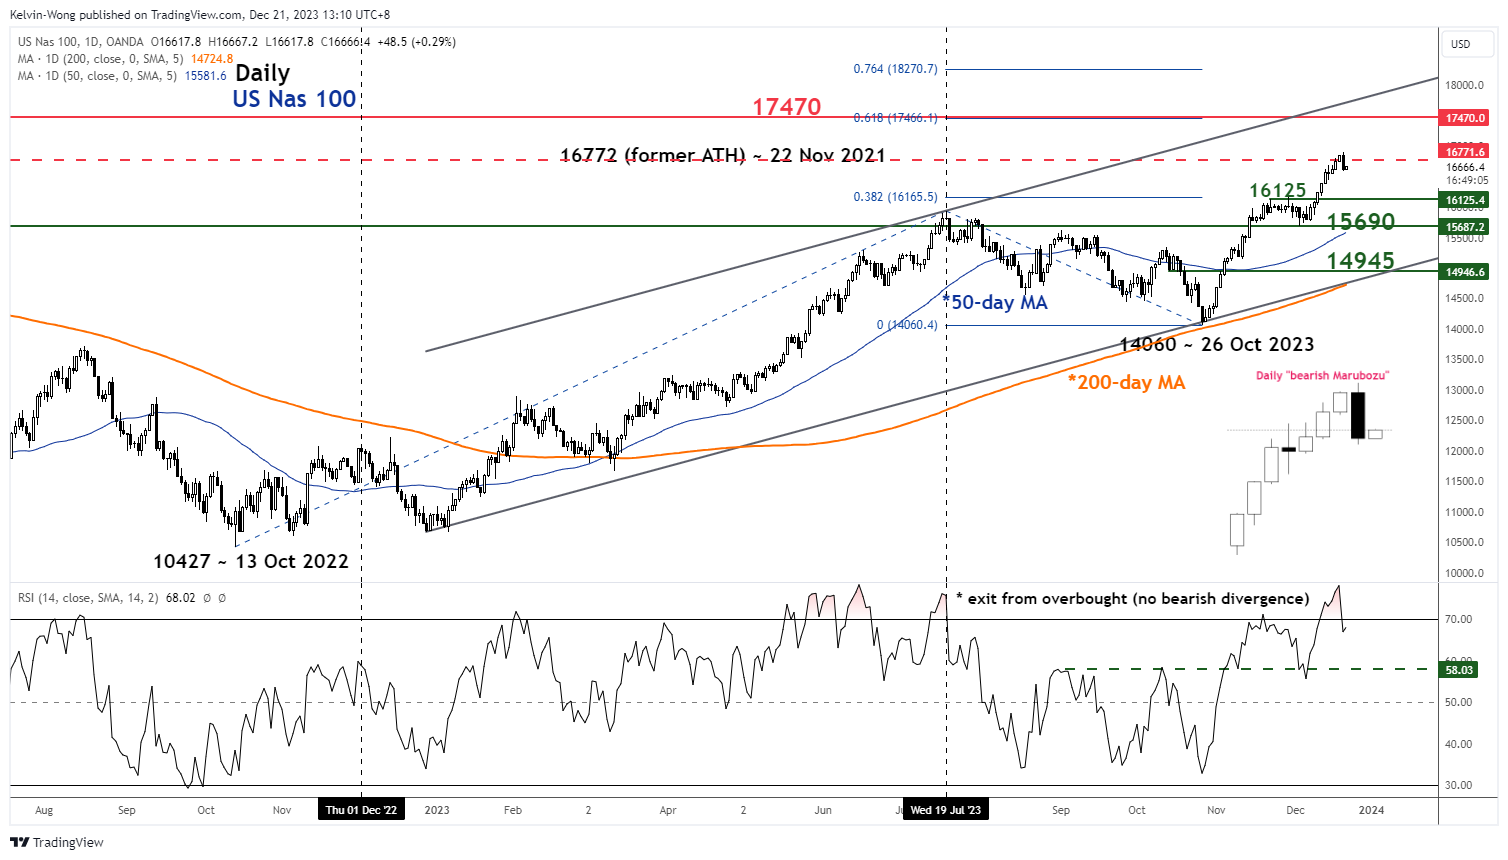
Fig 1: US Nas 100 medium-term trend as of 21 Dec 2023 (Source: TradingView, click to enlarge chart)
The US Nas 100 Index has formed a daily “bearish Marubozu” candlestick with a daily loss of -1.37% which is the steepest daily decline since the medium-term uptrend kickstarted on 27 October 2023.
These observations suggest the prior seven consecutive weeks of higher positive closes are likely to give way to a potential mean reversion decline sequence; at least a short-term multi-day corrective decline to retrace a portion of the enormous swift rally of +20% from the low of 23 October 2023 to yesterday’s fresh intraday all-time high of 16,898.
Short-term bullish trend exhaustion
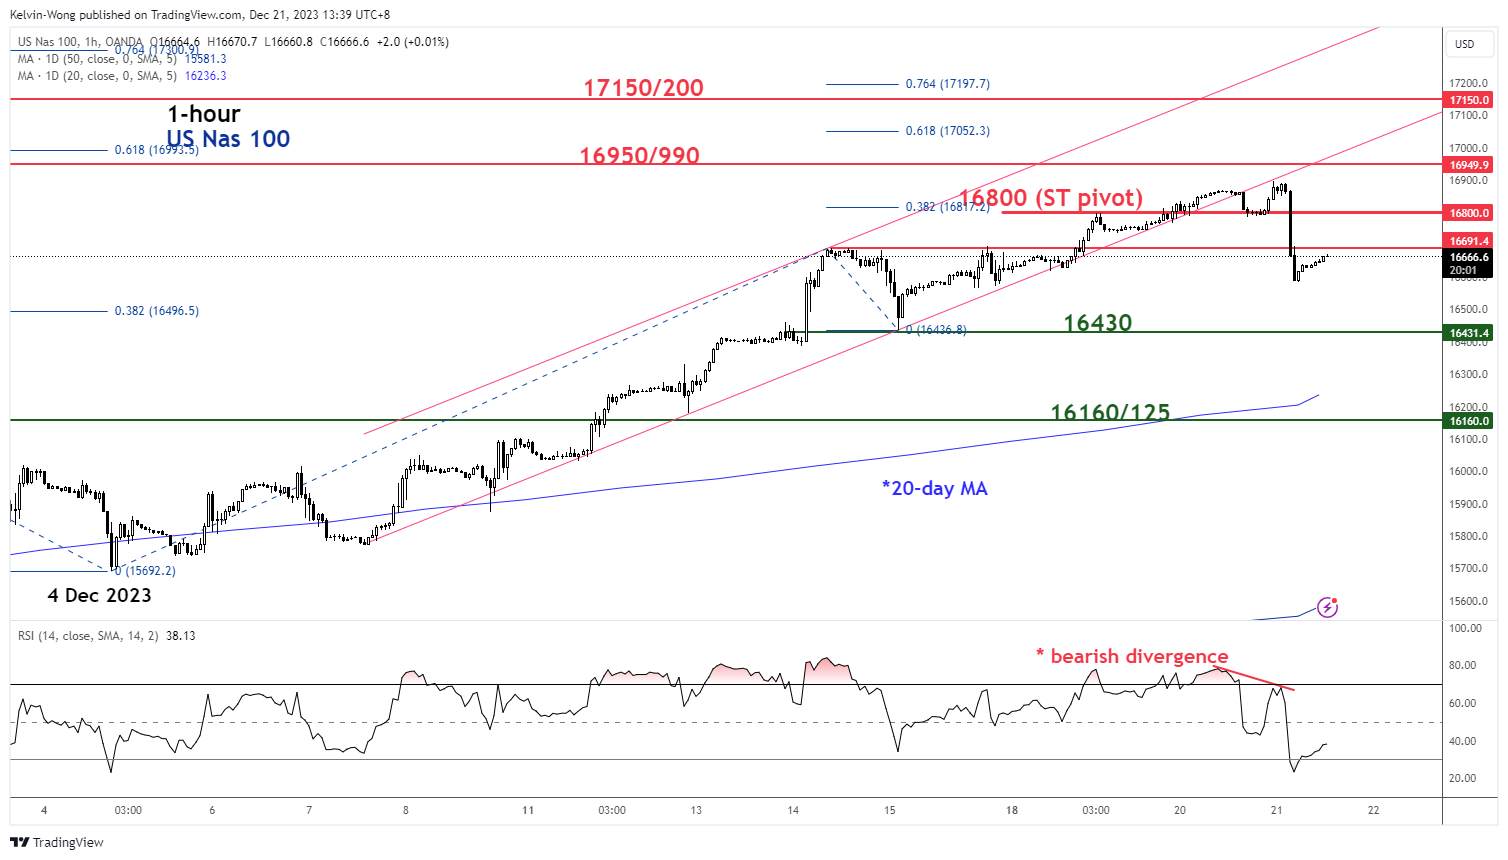
Fig 2: US Nas 100 minor short-term trend as of 21 Dec 2023 (Source: TradingView, click to enlarge chart)
Its price actions have broken below a minor ascending channel support from the 7 December 2023 low as depicted on the hourly chart.
The retest seen yesterday, 20 December on the former ascending channel support turned pull-back resistance has been accompanied by a bearish divergence condition flashed out on the hourly RSI momentum indicator at its overbought zone.
These short-term bearish elements have reinforced the potential start of a minor corrective decline sequence within its medium-term uptrend phase that is still intact.
If 16,800 key short-term pivotal resistance is not surpassed, the Index may see the next immediate support coming in at 16,430 and a break below it exposes the next support at 16,160/125 (also the upward sloping 20-day moving average).
On the flip side, a clearance above 16,800 invalidates the minor corrective decline scenario for a potential continuation of the bullish impulsive upmove towards the next immediate resistances of 16,950/990 and 17,150/200.
Content is for general information purposes only. It is not investment advice or a solution to buy or sell securities. Opinions are the authors; not necessarily that of OANDA Business Information & Services, Inc. or any of its affiliates, subsidiaries, officers or directors. If you would like to reproduce or redistribute any of the content found on MarketPulse, an award winning forex, commodities and global indices analysis and news site service produced by OANDA Business Information & Services, Inc., please access the RSS feed or contact us at [email protected]. Visit https://www.marketpulse.com/ to find out more about the beat of the global markets. © 2023 OANDA Business Information & Services Inc.
Latest posts by Kelvin Wong (see all)
- SEO Powered Content & PR Distribution. Get Amplified Today.
- PlatoData.Network Vertical Generative Ai. Empower Yourself. Access Here.
- PlatoAiStream. Web3 Intelligence. Knowledge Amplified. Access Here.
- PlatoESG. Carbon, CleanTech, Energy, Environment, Solar, Waste Management. Access Here.
- PlatoHealth. Biotech and Clinical Trials Intelligence. Access Here.
- Source: https://www.marketpulse.com/indices/nasdaq-100-technical-potential-start-of-minor-corrective-decline/kwong

