Gold Technical: On the cusp of a potential major bullish breakout
- Gold (XAU/USD) recorded its highest weekly gain of 2.33% year-to-date on 1 March 2024, and its best weekly return seen in the past three months.
- Positive technical elements and a softer real US 10-year Treasury yield below 2.15% support a potential major bullish breakout scenario for Gold (XAU/USD).
- Gold (XAU/USD) potential bullish breakout trigger level stands at US$2,090.
This is a follow-up analysis of our prior report, “Gold: Pivotal week after being sandwiched by opposing factors” published on 29 January 2024. Click here for a recap.
In the last two weeks, the price actions of Gold (XAU/USD) have started to jolt to the upside after a lull period of sideways movement since late December 2023. It has managed to record a weekly gain of 2.33% for the week ended 1 March 2024, its best weekly gain so far year-to-date and in the past three months.
Overall, it has exhibited bullish elements from a technical analysis perspective and intermarket cross-asset observations suggest the potential start of a medium-term bullish impulsive price action structure for Gold (XAU/USD).
Real US 10-year Treasury yield started to turn soft below 2.15% key resistance
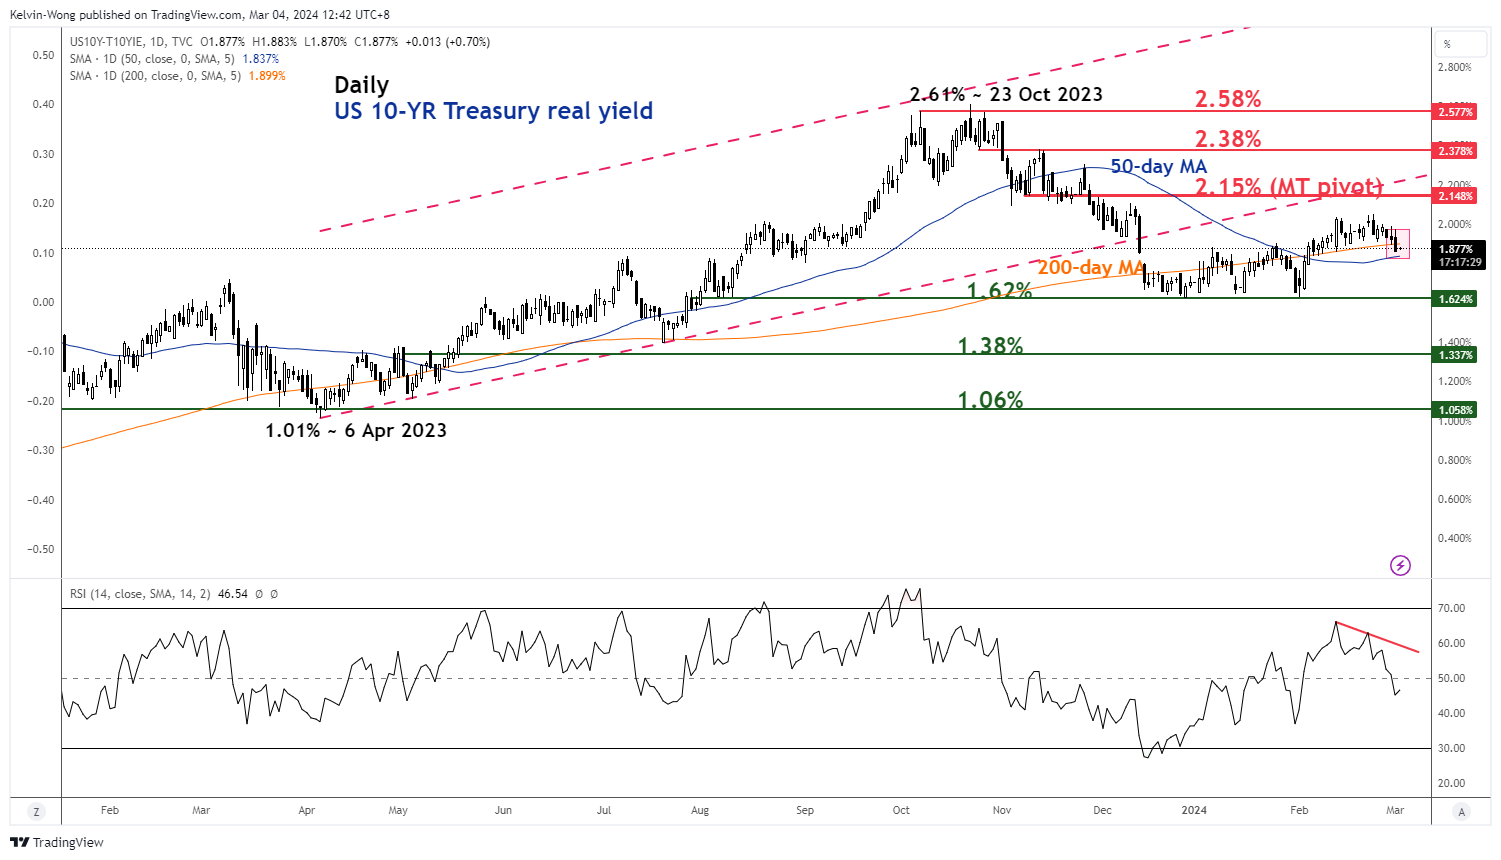
Fig 1: US 10-year Treasury real yield medium-term trend as of 4 Mar 2024 (Source: TradingView, click to enlarge chart)
In the past two weeks, the real US 10-year Treasury yield has started to inch lower (-19 basis points) from its 2.05% high printed on 23 February that wiped out the prior entire gains recorded earlier at the start of February to 13 February reinforced by the hotter than expected US CPI print for January.
Observations from key technical elements such as the reintegration back below its 200-day moving average last Friday, 1 March, and “prior lower highs” seen in the daily RSI momentum indicator before it pushed back down below the 50 level suggest that the short-term up move from 1 February is likely to have exhausted and the odds now are in favour of a medium-term down move as long as 2.15% key medium-term pivotal resistance is not surpassed to the upside.
Given that Gold (XAU/USD) has a significant indirect correlation with the real US 10-year Treasury yield as Gold does not yield any positive fixed income coupon, a further decline in the longer-term US Treasury yield is likely to support higher prices for Gold (XAU/USD).
Watch the key bullish breakout trigger level of US$ 2,090
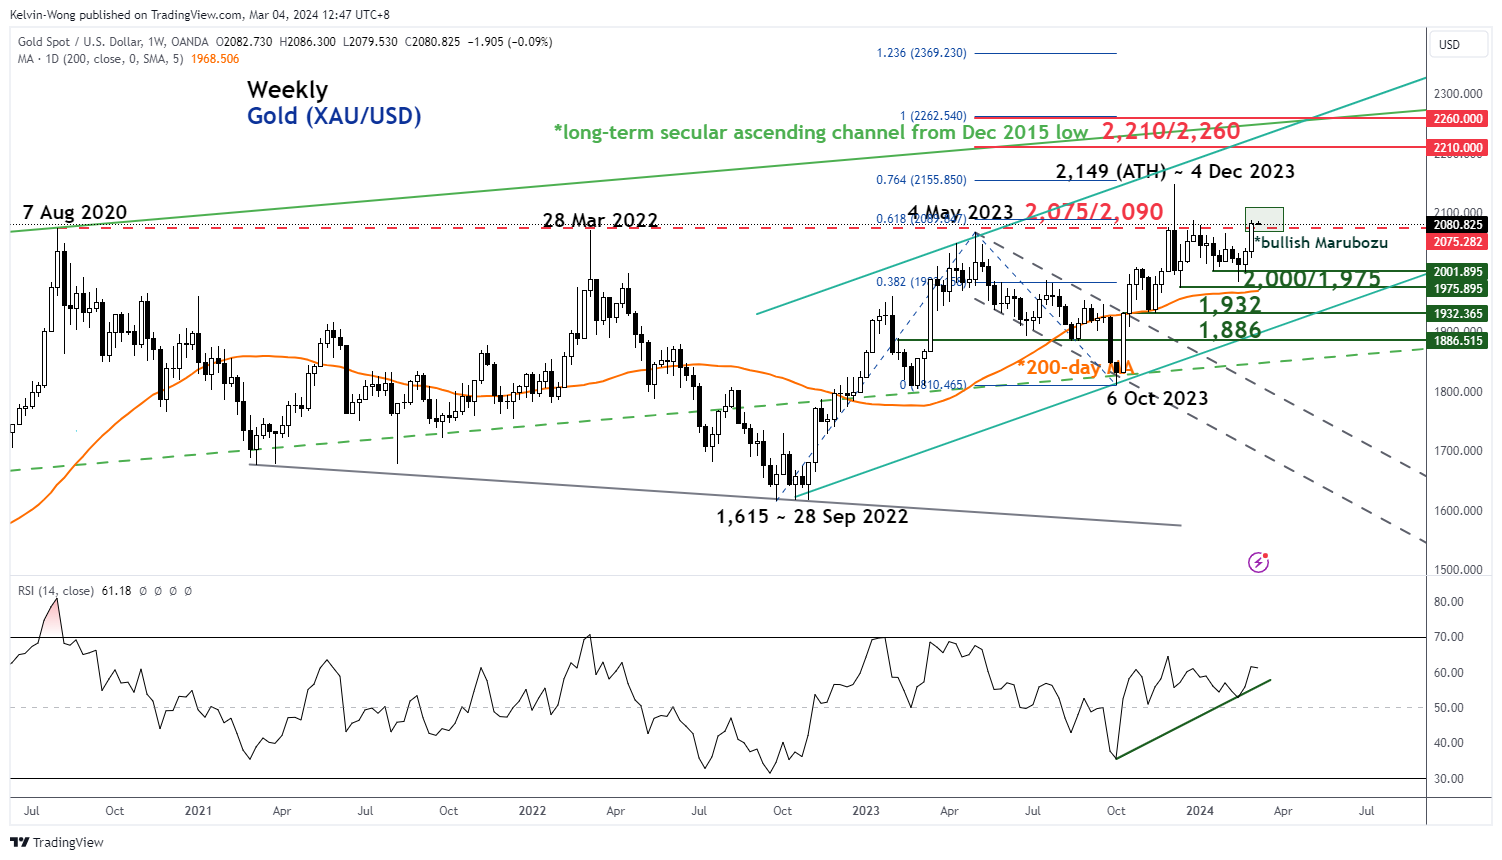
Fig 2: Gold (XAU/USD) medium-term & major trends as of 4 Mar 2024 (Source: TradingView, click to enlarge chart)
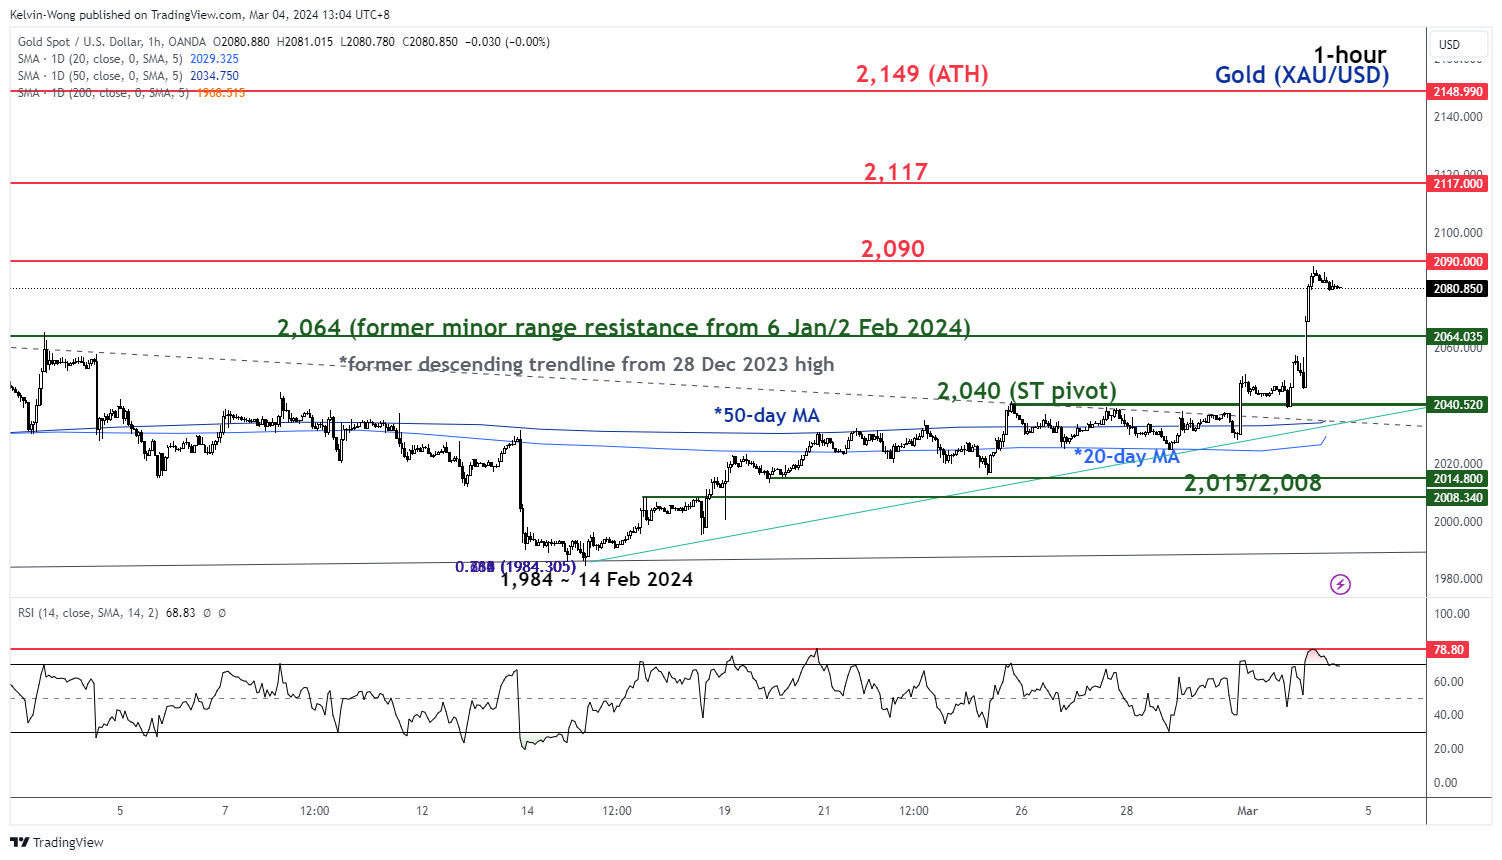
Fig 3: Gold (XAU/USD) short-term trend as of 4 Mar 2024 (Source: TradingView, click to enlarge chart)
Gold (XAU/USD) has now staged a fifth attempt on the major range resistance zone of US$2,075/2,090 of a complex sideways range configuration in place since 7 August 2020.
Interestingly, last week’s fifth attempt has managed to form a bullish candlestick pattern, a weekly bullish Marubozu right below US$2,090, and the prior four attempts did not yield such bullish candlestick-based price actions.
In addition, the weekly RSI momentum indicator has formed a “higher low” above the 50 level and has not reached the overbought region (above 70). These observations suggest that medium-term upside momentum is likely to have resurfaced. The next medium-term resistance zone to watch after US$2,090 will be at US$2,210/US$2,260 (Fibonacci extension cluster & upper boundary of a long-term secular ascending channel from December 2015 low, see Fig 2).
In the short-term, last Friday, 1 March steep upmove led the hourly RSI momentum indicator to hit an extreme overbought level of 78.80 which increases the risk of an imminent minor pull-back towards the US$2,064 near-term support (see Fig 3).
If the US$2,040 key short-term pivotal support holds in any potential pullbacks, the price actions of Gold (XAU/USD) are likely to evolve within short to medium-term bullish configurations. The next intermediate resistances to watch after US$2,090 (bullish range breakout level) are likely to be at US$2,117 and US$2,149 (current all-time high printed on 4 December 2023) in the short term.
On the flipside, failure to hold at US$2,040 invalidates the bullish tone to see an extension of the corrective pull-back to expose the next intermediate support at US$2,015/US$2,008 (congestion zone of 16/23 February 2024 & 76.4% Fibonacci retracement of the ongoing minor uptrend from 14 February 2024 low to 1 March 2024 high).
Content is for general information purposes only. It is not investment advice or a solution to buy or sell securities. Opinions are the authors; not necessarily that of OANDA Business Information & Services, Inc. or any of its affiliates, subsidiaries, officers or directors. If you would like to reproduce or redistribute any of the content found on MarketPulse, an award winning forex, commodities and global indices analysis and news site service produced by OANDA Business Information & Services, Inc., please access the RSS feed or contact us at [email protected]. Visit https://www.marketpulse.com/ to find out more about the beat of the global markets. © 2023 OANDA Business Information & Services Inc.
Passionate about connecting the dots in the financial markets and sharing perspectives around trading and investment, Kelvin Wong is an expert in using a unique combination of fundamental and technical analyses, specializing in Elliott Wave and fund flow positioning, to pinpoint key reversal levels in the financial markets.
In addition, over the last ten years, Kelvin has conducted numerous market outlook and trading-related seminars, as well as technical analysis training courses, for thousands of retail traders.
Latest posts by Kelvin Wong (see all)
- SEO Powered Content & PR Distribution. Get Amplified Today.
- PlatoData.Network Vertical Generative Ai. Empower Yourself. Access Here.
- PlatoAiStream. Web3 Intelligence. Knowledge Amplified. Access Here.
- PlatoESG. Carbon, CleanTech, Energy, Environment, Solar, Waste Management. Access Here.
- PlatoHealth. Biotech and Clinical Trials Intelligence. Access Here.
- Source: https://www.marketpulse.com/commodities/gold-technical-on-the-cusp-of-a-potential-major-bullish-breakout/kwong

