- Medium-term uptrend of Gold (XAU/USD) remains intact.
- Its recent slide of -1.7% from the 20 July 2023 high of US$1,987.53 has pull-backed close to its 50-day moving average.
- Short-term elements suggest a potential bullish reversal for Gold (XAU/USD) with key support at US$1,939.
This is a follow-up analysis of our prior report, “Resilient gold is supported by geopolitical risk” published on 11 July 2023. Click here for a recap.
Gold (XAU/USD) has staged the bullish breakout above US$1,940 and rallied to an intraday high of US$1,987.53 on 20 July 2023, just a whisker away from the US$1,990 resistance (former congestion support zone from 10 April 2023 to 16 May 2023).
The medium-term uptrend remains intact
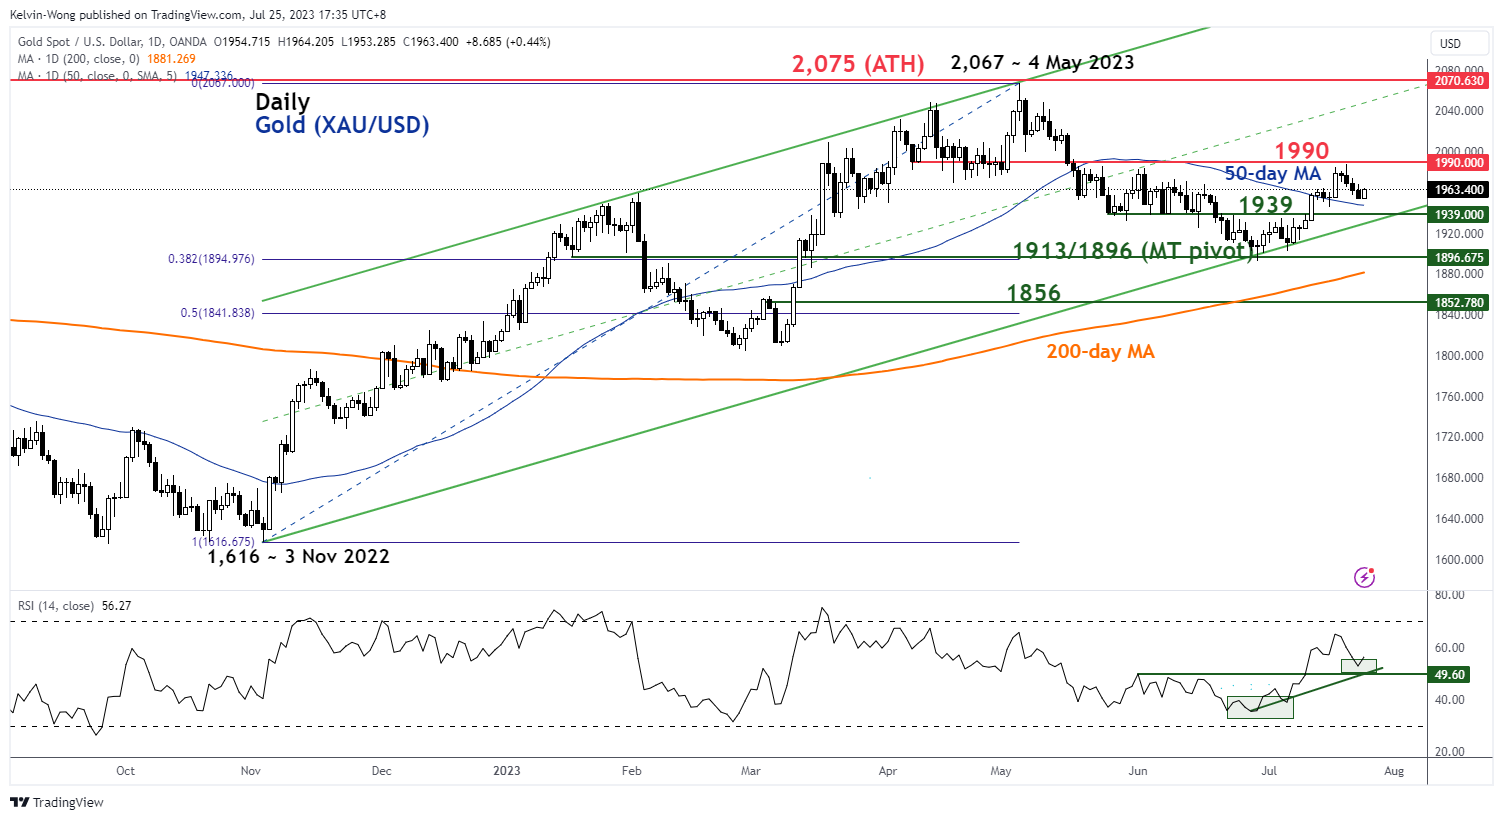
Fig 1: Gold (XAU/USD) medium-term trend of 25 Jul 2023 (Source: TradingView, click to enlarge chart)
Despite the recent slide of -1.7% from the 20 July 2023 high to print an intraday low of US$1,953.28, the medium-term uptrend phase of Gold (XAU/USD) in place since the 3 November 2022 low of US$1,616 remains intact as it price actions held right above the 50-day moving average at this time of the writing.
Short-term downside momentum has waned
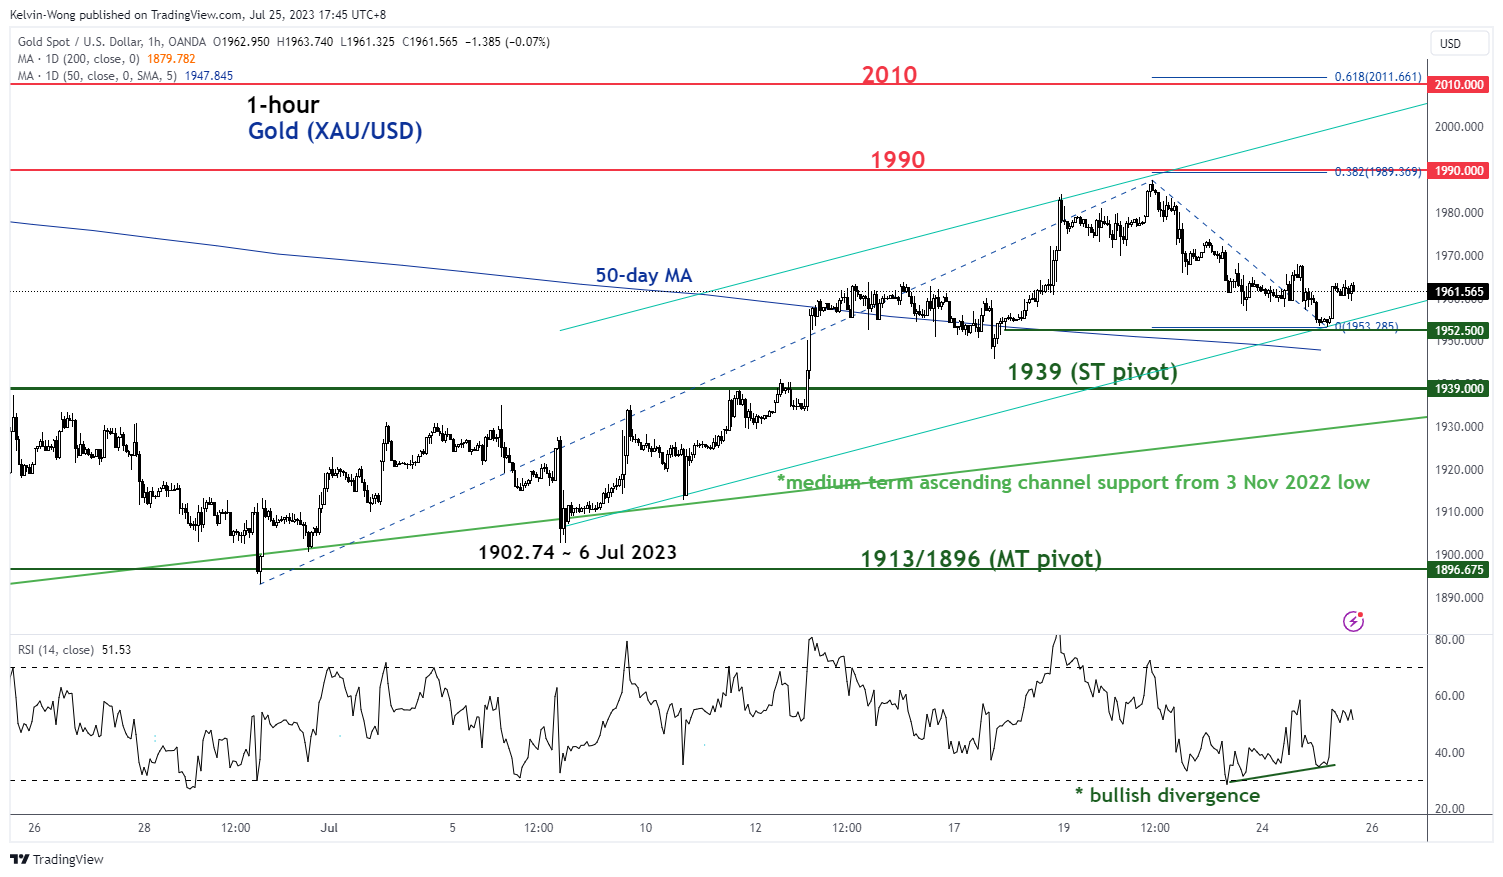
Fig 2: Gold (XAU/USD) minor short-term uptrend of 25 Jul 2023 (Source: TradingView, click to enlarge chart)
As seen on the 1-hour chart of Gold (XAU/USD), its recent slide from its 20 July 2023 high of US$ US$1,987.53 has reached the lower boundary of a minor ascending channel from 6 July 2023 low now acting as near-term support at US$1,952.50.
In addition, the hourly RSI oscillator has flashed a bullish divergence signal at its oversold region. These observations suggest that the downside momentum of the 5-day slide from the 20 July 2023 high has started to wane where a potential short-term bullish reversal may take shape.
Watch the US$1,939 key short-term pivotal support (also close to the 50-day moving average) with the intermediate resistance at US$1,990, and clearance above it sees US$2,010 next (the upper boundary of the minor ascending channel).
However, a break below US$1,939 invalidates the bullish reversal scenario to expose the medium-term support zone of US$1,913/1,896.
Content is for general information purposes only. It is not investment advice or a solution to buy or sell securities. Opinions are the authors; not necessarily that of OANDA Business Information & Services, Inc. or any of its affiliates, subsidiaries, officers or directors. If you would like to reproduce or redistribute any of the content found on MarketPulse, an award winning forex, commodities and global indices analysis and news site service produced by OANDA Business Information & Services, Inc., please access the RSS feed or contact us at [email protected]. Visit https://www.marketpulse.com/ to find out more about the beat of the global markets. © 2023 OANDA Business Information & Services Inc.
Latest posts by Kelvin Wong (see all)
- SEO Powered Content & PR Distribution. Get Amplified Today.
- PlatoData.Network Vertical Generative Ai. Empower Yourself. Access Here.
- PlatoAiStream. Web3 Intelligence. Knowledge Amplified. Access Here.
- PlatoESG. Automotive / EVs, Carbon, CleanTech, Energy, Environment, Solar, Waste Management. Access Here.
- BlockOffsets. Modernizing Environmental Offset Ownership. Access Here.
- Source: https://www.marketpulse.com/gold/gold-technical-holding-above-50-day-moving-average/kwong

