- The minor pull-back of Spot Gold (XAU/USD) from last Friday, 20 October high of US$1,997 may have ended on Tuesday, 24 October with an intraday low of US$1,953.
- Daily and 1-hour RSI indicators are showing a revival of bullish momentum.
- Next intermediate resistances are at US$2,006 and US$2,028/2,037.
This is a follow-up analysis of our prior report, “Gold Technical: At the risk of a minor pull-back before potential new upleg” published on 23 October 2023. Click here for a recap.
Spot Gold (XAU/USD) has indeed shaped the minor pull-back so far of 2.2% from last Friday, 20 October high of US$1, 997 to print an intraday low of US$1,953 on Tuesday, 24 October but fell short of hitting the expected support zone of US$1,1932/1,920 as highlighted in our previous report.
Revival of bullish momentum
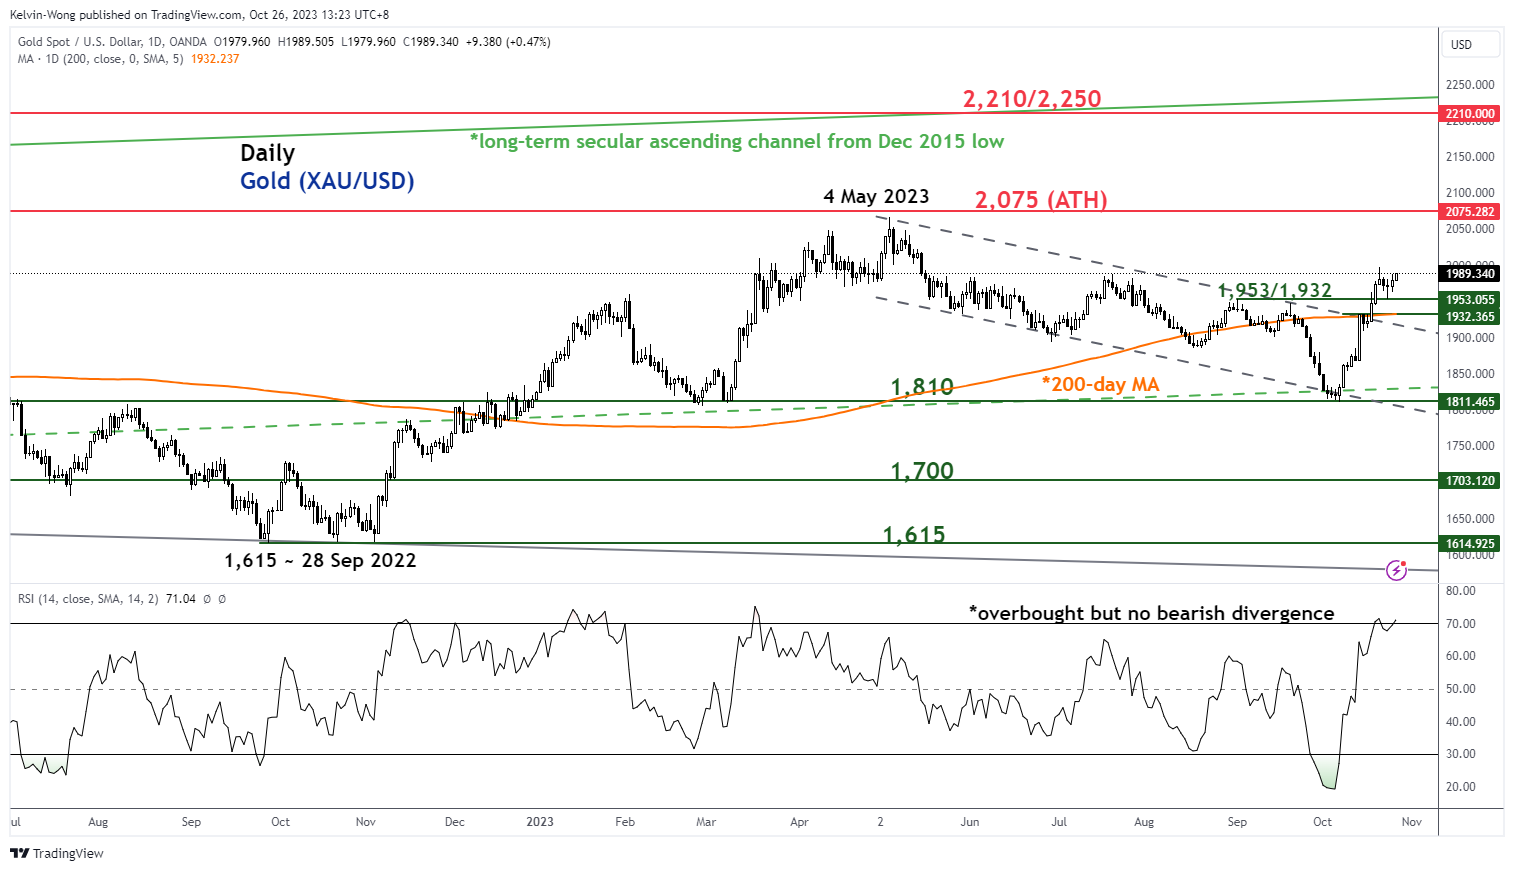
Fig 1: Spot Gold (XAU/USD) medium-term trend as of 26 Oct 2023 (Source: TradingView, click to enlarge chart)
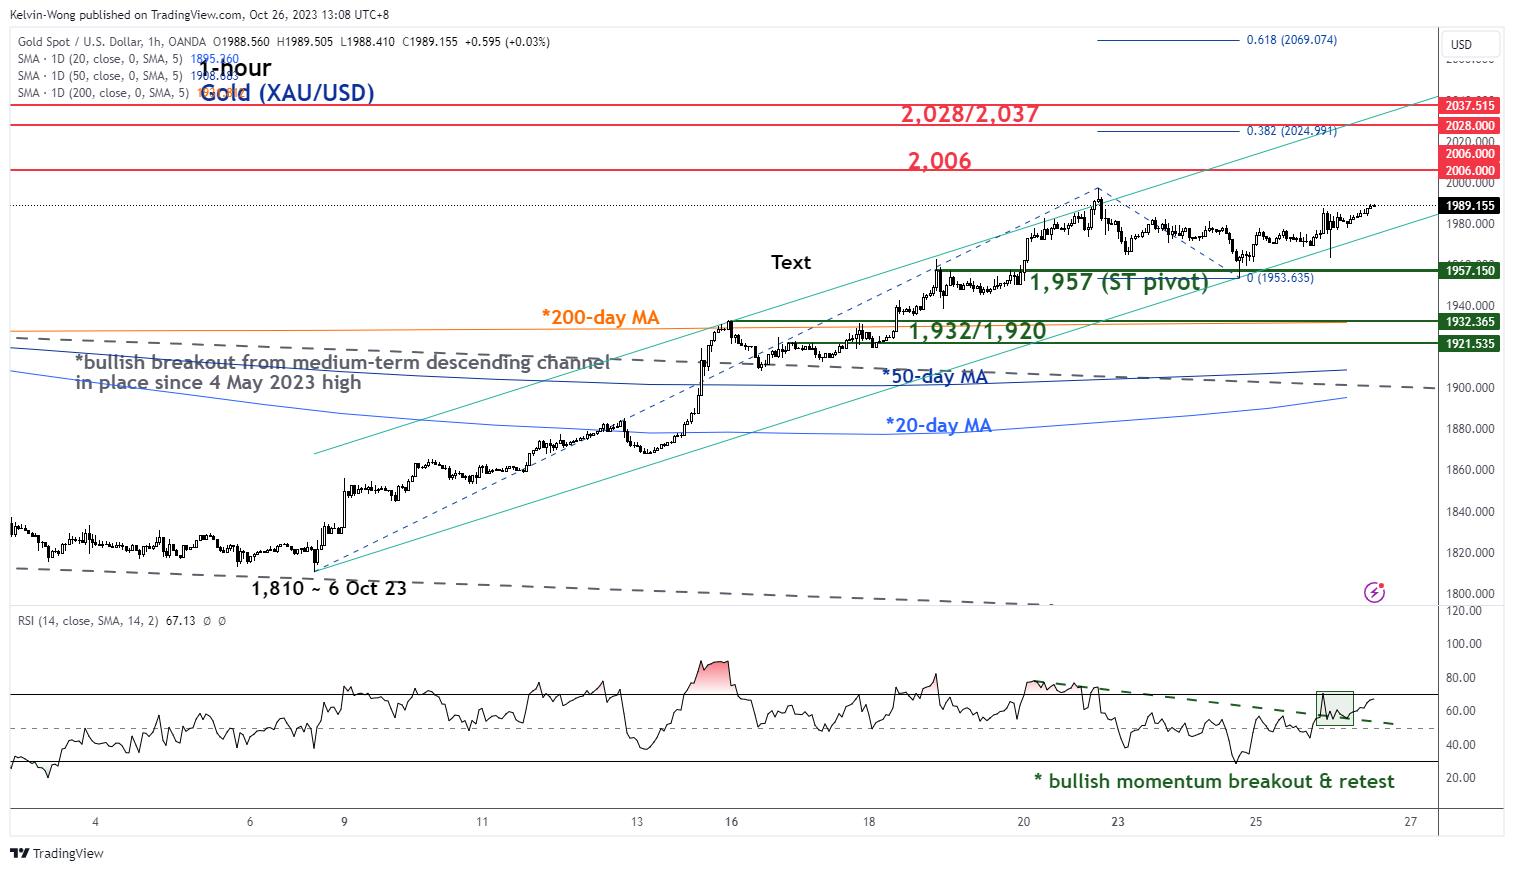
Fig 2: Spot Gold (XAU/USD) minor short-term trend as of 26 Oct 2023 (Source: TradingView, click to enlarge chart)
Current price actions in the past two days of Spot Gold (XAU/USD) have exhibited signs of bullish momentum.
Firstly, the daily RSI momentum indicator has not flashed any clear bearish divergence condition despite being at the overbought region (above 70) which in turn suggests the medium-term uptrend phase in place since the 6 October 2023 low of US$1,810 is still likely to have inertia to shape “higher highs” in price actions (see Figure 1).
Secondly, in the lower time frame as indicated by the 1-hour RSI, it has staged a bullish breakout from a parallel descending resistance with a retest on it yesterday, 25 October (see Figure 2).
All in all, these latest key technical developments have suggested that the minor pull-back of Spot Gold (XAU/USD) may have ended and it is likely to be in the midst of another potential impulsive up move sequence within its medium-term uptrend phase.
Watch the key short-term pivotal support at US$1,957 with the next intermediate resistances coming in at US$2,006 and US$2,028/2,037 (upper boundary of the short-term ascending channel from 6 October 2023 low & Fibonacci extension).
On the other hand, a break below US$1,957 negates the bullish tone to revive an extended pull-back scenario to expose the support zone of US$1,932/1,920 (also the 200-day moving average).
Content is for general information purposes only. It is not investment advice or a solution to buy or sell securities. Opinions are the authors; not necessarily that of OANDA Business Information & Services, Inc. or any of its affiliates, subsidiaries, officers or directors. If you would like to reproduce or redistribute any of the content found on MarketPulse, an award winning forex, commodities and global indices analysis and news site service produced by OANDA Business Information & Services, Inc., please access the RSS feed or contact us at [email protected]. Visit https://www.marketpulse.com/ to find out more about the beat of the global markets. © 2023 OANDA Business Information & Services Inc.
Latest posts by Kelvin Wong (see all)
- SEO Powered Content & PR Distribution. Get Amplified Today.
- PlatoData.Network Vertical Generative Ai. Empower Yourself. Access Here.
- PlatoAiStream. Web3 Intelligence. Knowledge Amplified. Access Here.
- PlatoESG. Carbon, CleanTech, Energy, Environment, Solar, Waste Management. Access Here.
- PlatoHealth. Biotech and Clinical Trials Intelligence. Access Here.
- Source: https://www.marketpulse.com/commodities/gold-technical-bullish-impulsive-up-move-may-have-resumed/kwong

