- Spot Gold (XAU/USD) has a significant indirect correlation with the 10-year US Treasury yield since May 2023.
- A potential short-term pull-back in US 10-year Treasury yield below a 4.90% key medium-term resistance may offer a “relief mean reversion rebound” on spot Gold.
- Watch the key support of US$1,810 on spot Gold.
In the past two weeks, the price of spot Gold (XAU/USD) has tumbled swiftly by -6.90% from its 21 September 2023 high of US$1,947 to a seven-month low of US$1,813 printed on Thursday, 5 October.
The primary driver has been the rapidly rising longer-term US Treasury yields that increase the opportunity cost of holding gold due to its “zero-yielding asset” nature. The 10-year US Treasury yield, a benchmark for long-term interest rates has increased by 158 basis points from its May 2023 low to a recent high of 4.88% on Wednesday, 4 October.
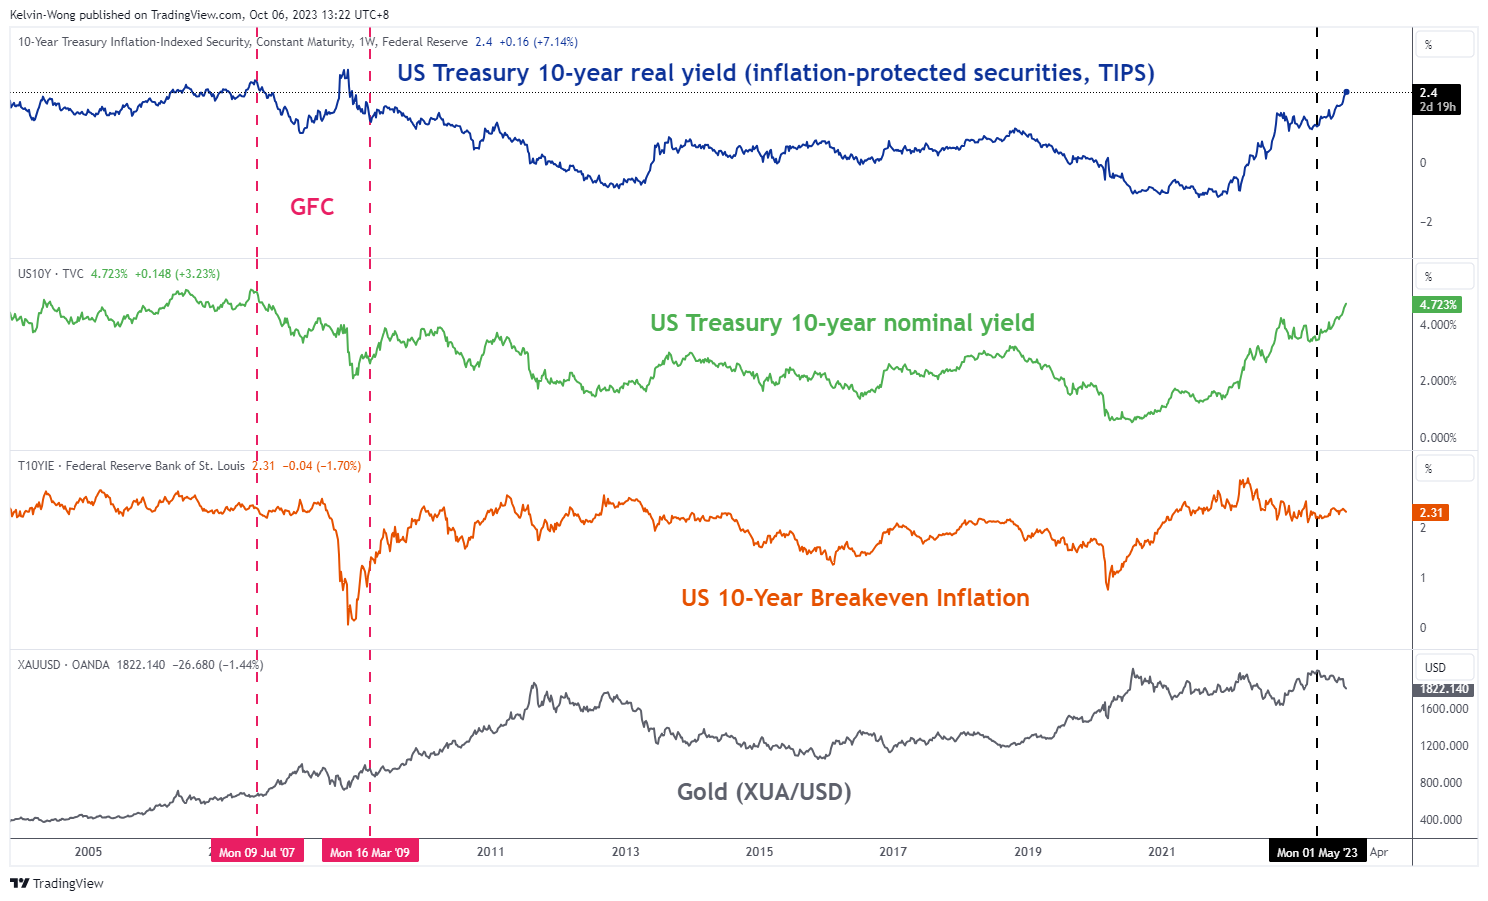
Fig 1: Spot Gold (XAU/USD) correlation with 10-year US Treasury yield as of 6 Oct 2023 (Source: TradingView, click to enlarge chart)
Potential pull-back for US 10-year Treasury yield
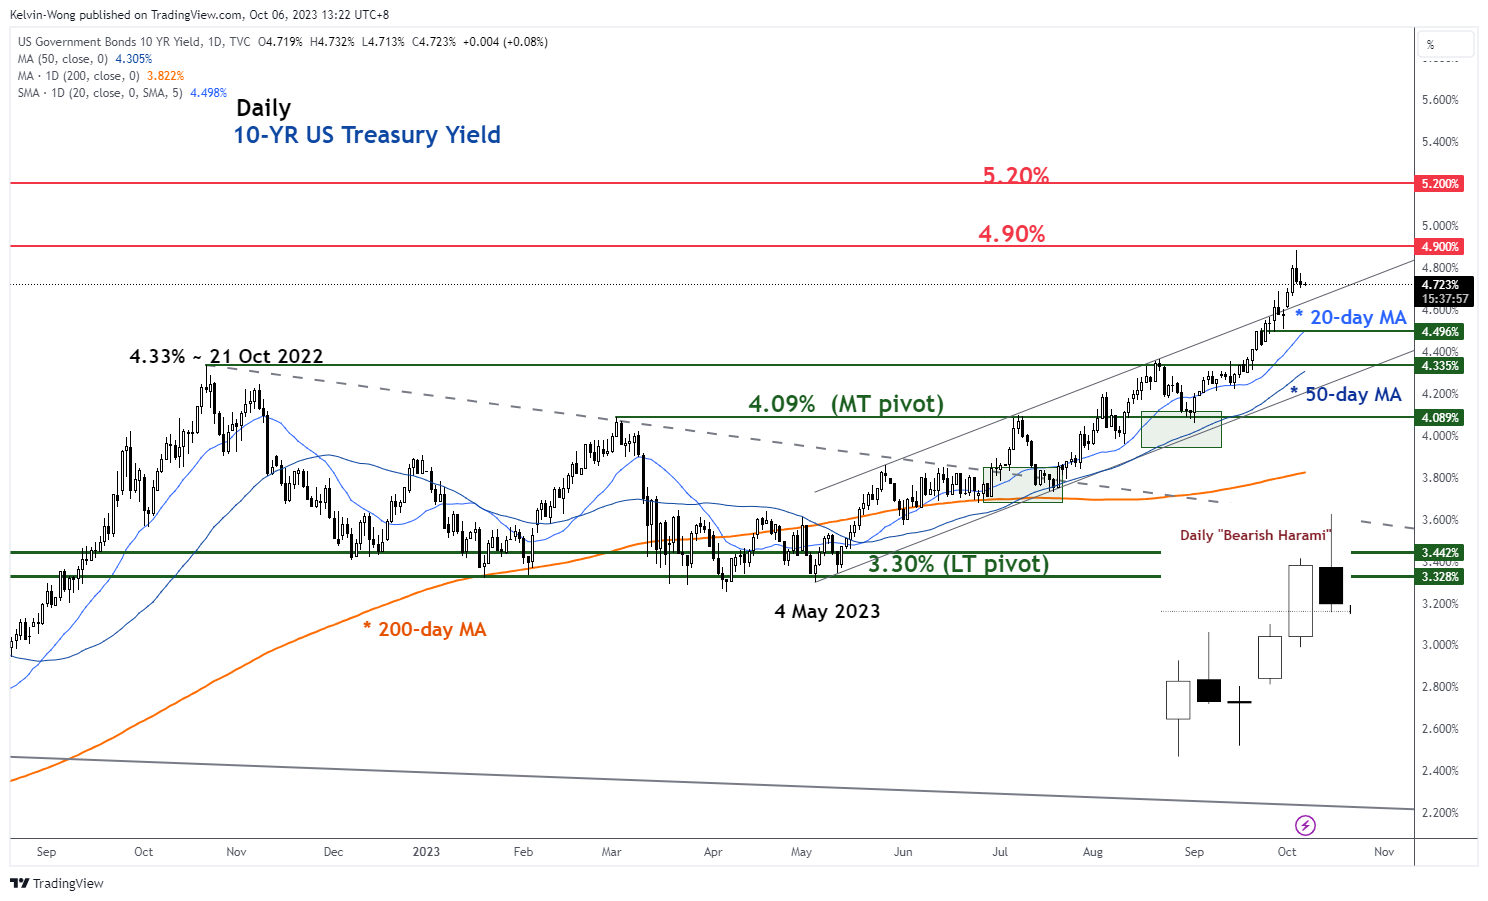
Fig 2: US 10-year Treasury yield medium-term trend as of 6 Oct 2023 (Source: TradingView, click to enlarge chart)
Its current short-term uptrend phase from the 1 September 2023 low of 4.06% has been overextended to the upside where it has formed a “Bearish Harami” right below a key-medium resistance of 4.90%, a two-candlestick bearish reversal pattern taking into account of its price actions on 3 and 4 October 2023 as seen on the daily chart.
Hence, the 10-yield US Treasury yield may start to shape a pull-back towards its 20 and 50-day moving averages acting as a support zone of 4.50%/4.33% that can provide some form of short-term ‘relief mean reversion rebound” for spot Gold (XAU/USD) given its significant indirect correlation with the 10-yield US Treasury yield since May 2023.
Watch the US$1,810 key medium-term support on Gold
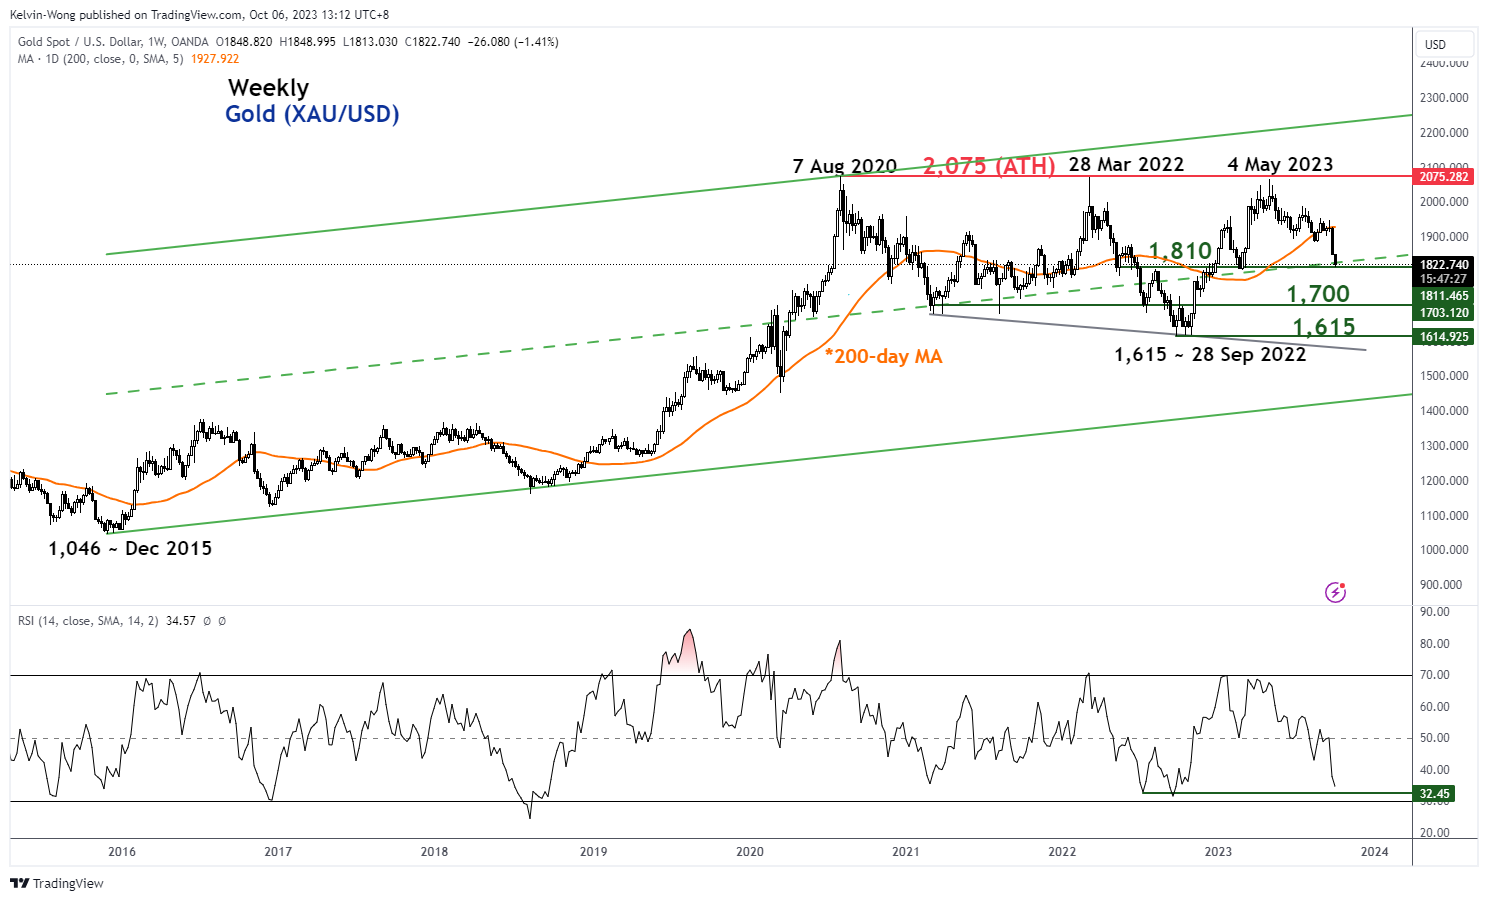
Fig 3: Spot Gold (XAU/USD) major trend as of 6 Oct 2023 (Source: TradingView, click to enlarge chart)
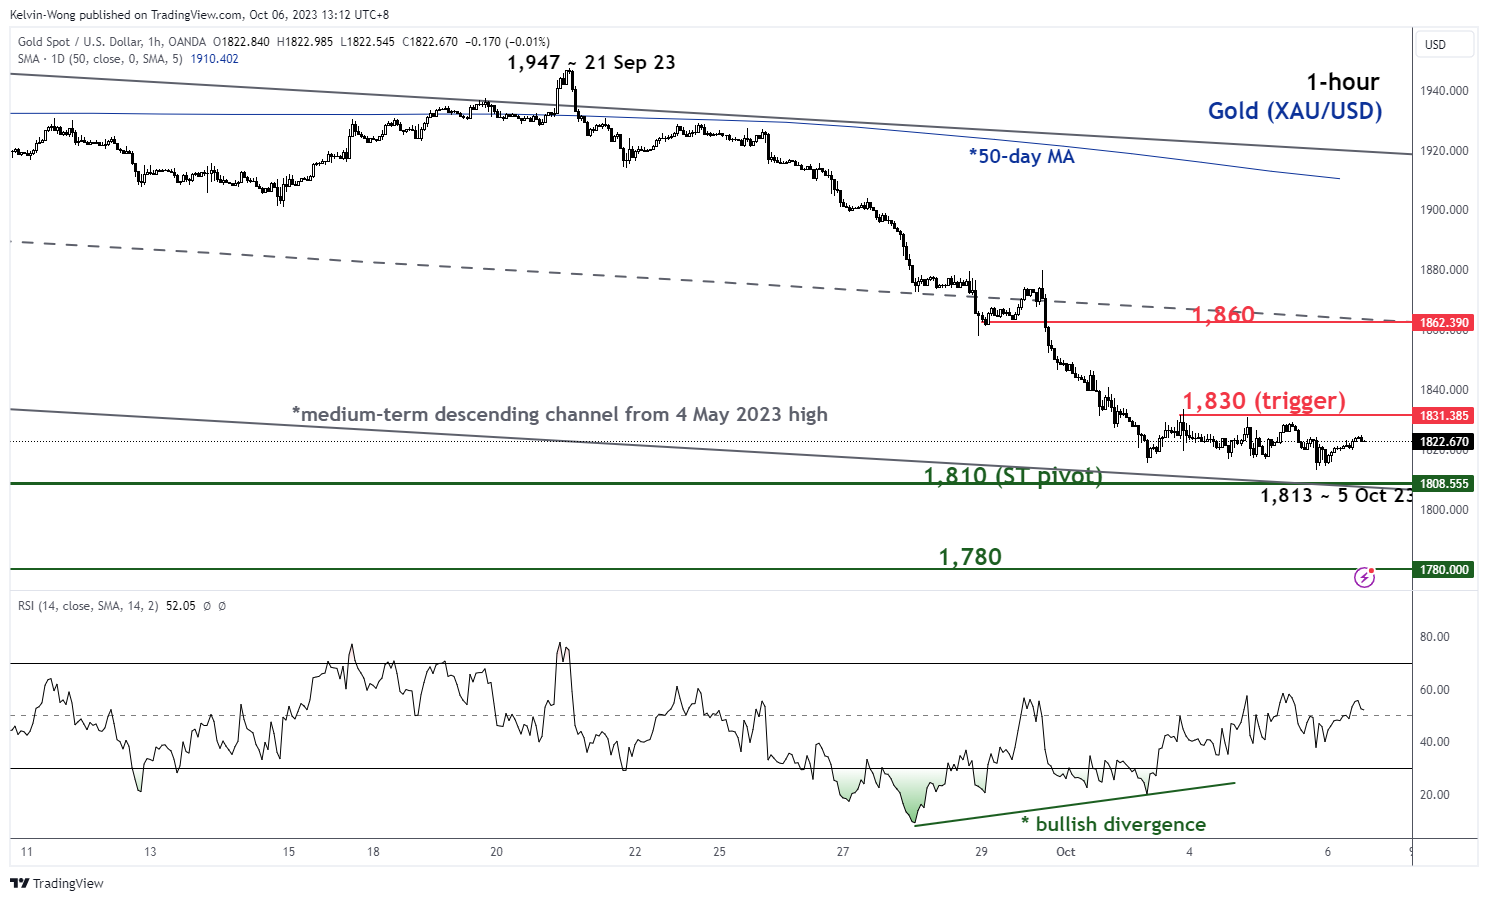
Fig 4: Spot Gold (XAU/USD) minor short-term trend as of 6 Oct 2023 (Source: TradingView, click to enlarge chart)
The five-month medium-term downtrend phase of spot Gold (XAU/USD) from its 4 May 2023 high of US$2,067 has reached a key medium-term support of US$1,810 which is defined by the median line of the long-term secular ascending channel in place since December 2015 low and close to the 61.8% Fibonacci retracement of the prior major uptrend phase from 28 September 2022 low to 4 May 2023 high as seen on the daily chart.
On the shorter-term chart, the 1-hour RSI oscillator has flashed a recent bullish divergence condition at its oversold region which suggests that the downside momentum of its short-term downtrend phase from the 21 September 2023 high to 5 October 2023 low has eased.
These observations suggest a potential short-term counter trend mean reversion rebound scenario may occur next. A break above the near-term resistance of US$1,830 sees the next resistance coming in at US$1,860 (the median line of the medium-term descending channel from 4 May 2023 high & 38.2% Fibonacci retracement of the recent decline from 21 September 2023 high to 5 October 2023 low).
On the other hand, a break below the US$1,810 pivotal support invalidates the mean reversion rebound scenario to expose the next support at US$1,780 (minor congestion area from 15 November 2023 to 15 December 2022) in the first step.
Content is for general information purposes only. It is not investment advice or a solution to buy or sell securities. Opinions are the authors; not necessarily that of OANDA Business Information & Services, Inc. or any of its affiliates, subsidiaries, officers or directors. If you would like to reproduce or redistribute any of the content found on MarketPulse, an award winning forex, commodities and global indices analysis and news site service produced by OANDA Business Information & Services, Inc., please access the RSS feed or contact us at [email protected]. Visit https://www.marketpulse.com/ to find out more about the beat of the global markets. © 2023 OANDA Business Information & Services Inc.
Latest posts by Kelvin Wong (see all)
- SEO Powered Content & PR Distribution. Get Amplified Today.
- PlatoData.Network Vertical Generative Ai. Empower Yourself. Access Here.
- PlatoAiStream. Web3 Intelligence. Knowledge Amplified. Access Here.
- PlatoESG. Carbon, CleanTech, Energy, Environment, Solar, Waste Management. Access Here.
- PlatoHealth. Biotech and Clinical Trials Intelligence. Access Here.
- Source: https://www.marketpulse.com/commodities/gold-technical-a-consolidation-in-the-10-year-us-treasury-yield-may-offer-a-relief-bounce/kwong

