- Positive price actions in Gold (XAU/USD) as it reintegrated back above its 20-day moving average.
- A continuation of the medium-term bearish trend on the US 10-year Treasury real yield below 1.82% key resistance may add further bullish impetus for Gold.
- A rise in geopolitical risk premium may also support a firmer Gold.
- Watch the US$2,015 key short-term support on Gold (XAU/USD).
This is a follow-up analysis of our prior report, “Gold: A further deterioration in the US 10-year Treasury yield may support a bullish tone” published on 18 December 2023. Click here for a recap.
Since our last analysis, Gold (XAU/USD) has traded sideways and held firm above the prior US$1,997 key short-term support and its upward-sloping 50-day moving average.
After a slew of key economic data that was released last week (US CPI & PPI for December), Gold (XAU/USD) has managed to hold above the 50-day moving average and reintegrated back above its 20-day moving average last Friday, 12 December with a daily close of US$2,049 over the 20-day moving average value of US$2,044.
There are two other intermarket positive developments on top of the sole positive price actions that may support a bullish tone in Gold (XAU/USD) in the short to medium-term time frame.
Lower opportunity cost for holding Gold
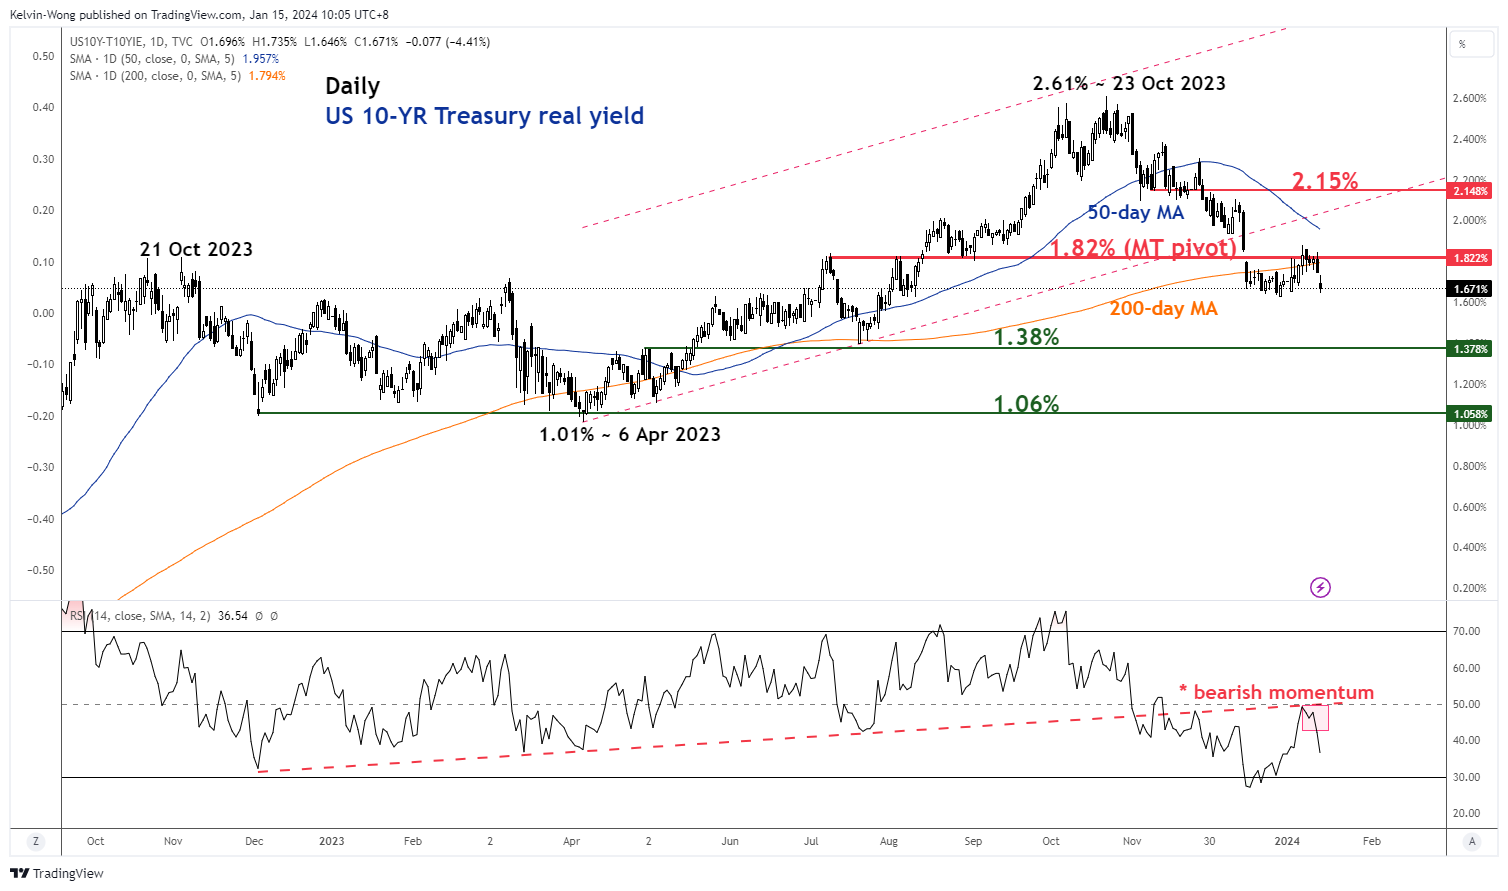
Fig 1: US 10-year Treasury real yield medium-term trend as of 12 Jan 2024 (Source: TradingView, click to enlarge chart)
The US 10-year Treasury real yield has shaped a bearish reaction right at its 1.82% key medium-term pivotal resistance and reintegrated back below the 200-day moving average.
In addition, the daily RSI momentum indicator has failed to break above the 50 level after a retest which suggests that medium-term bearish momentum is likely to have resurfaced.
These observations suggest that the price actions of the US 10-year Treasury real yield may trend lower towards the next medium-term support of 1.38% which in turn lowers the opportunity cost of holding long positions in Gold.
Rising geopolitical risk premium
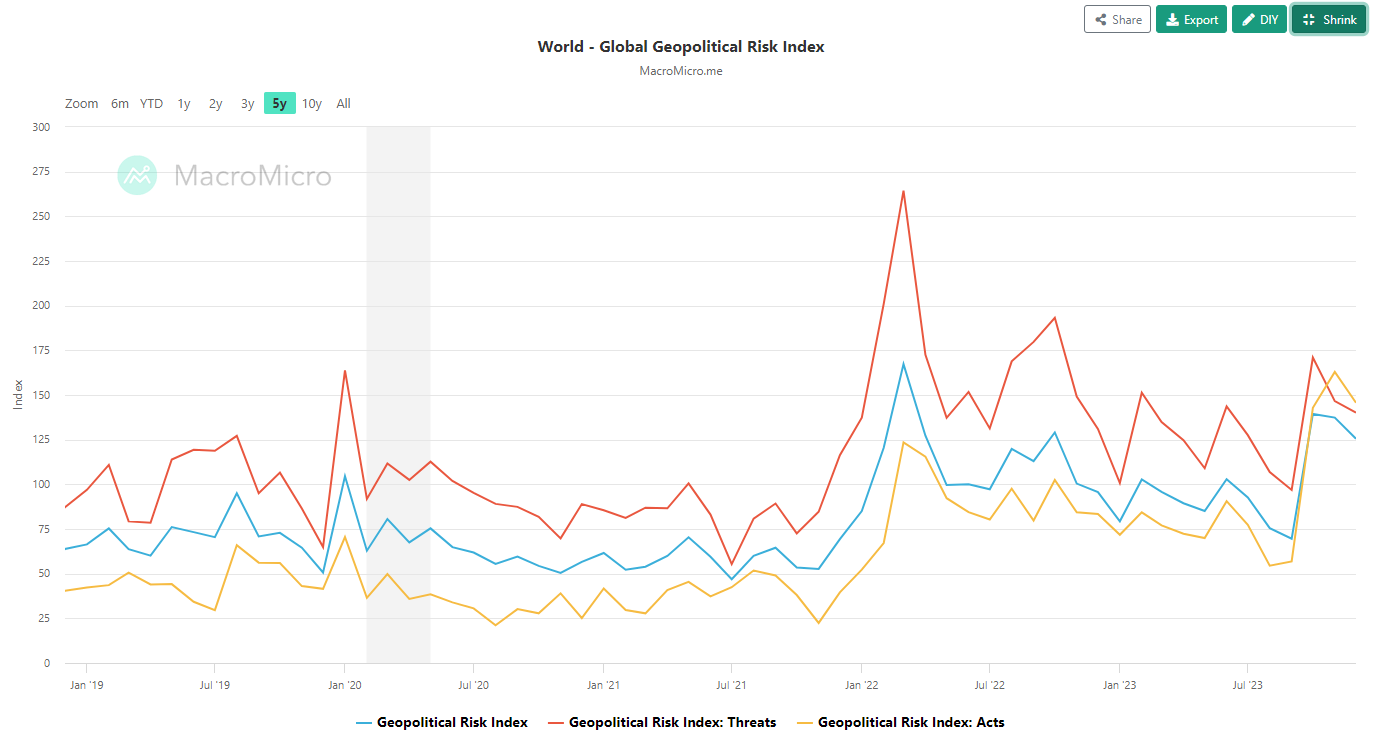
Fig 2: World Geopolitical Risk Index as of Dec 2023 (Source: Macro Micro, click to enlarge chart)
Secondly, rising geopolitical risk premium as hostilities escalate in the Red Sea shipping route while Yemen’s Houthi rebels are showing no signs of backing down from their series of attacks since late October 2023 that targeted Southern Israel and ships in the Red Sea that were linked to Israel in the ongoing Israel-Hamas war.
The current uptick in geopolitical tension from the Middle East region is also reflected in the Global Geopolitical Risk Index (GPR) compiled by US Federal Reserve economists Dario Caldara and Matteo lacoviello. The GPR Index has been trending up since September 2023 with its current December 2023 reading of 125.47, the highest level since March 2022’s reading of 167.29 during the onset of the Russian invasion of Ukraine.
Potential bullish range breakout for Gold
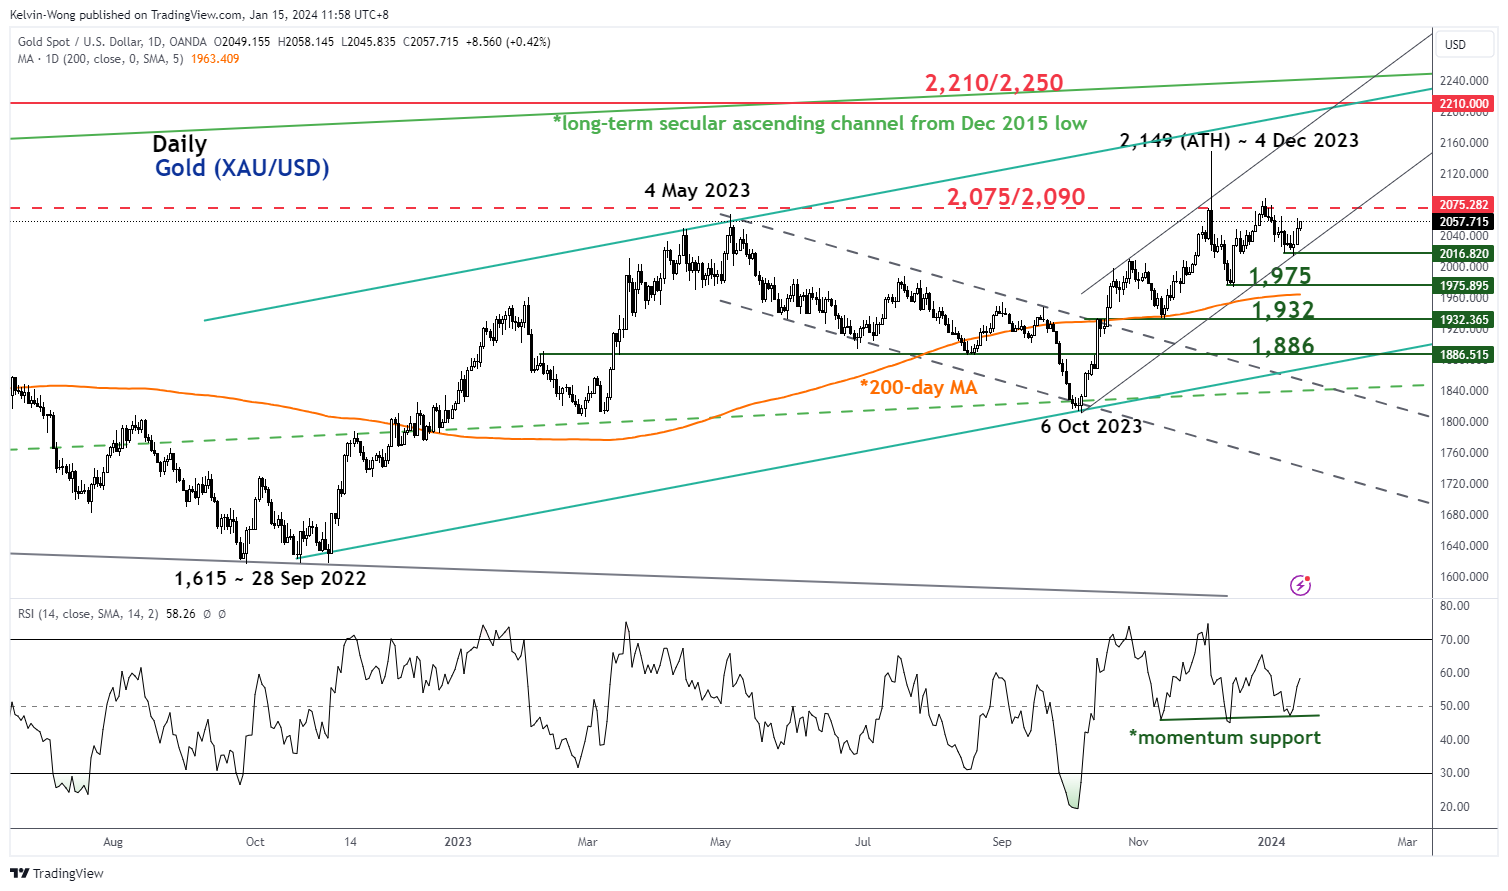
Fig 3: Gold (XAU/USD) medium-term trend as of 15 Jan 2024 (Source: TradingView, click to enlarge chart)
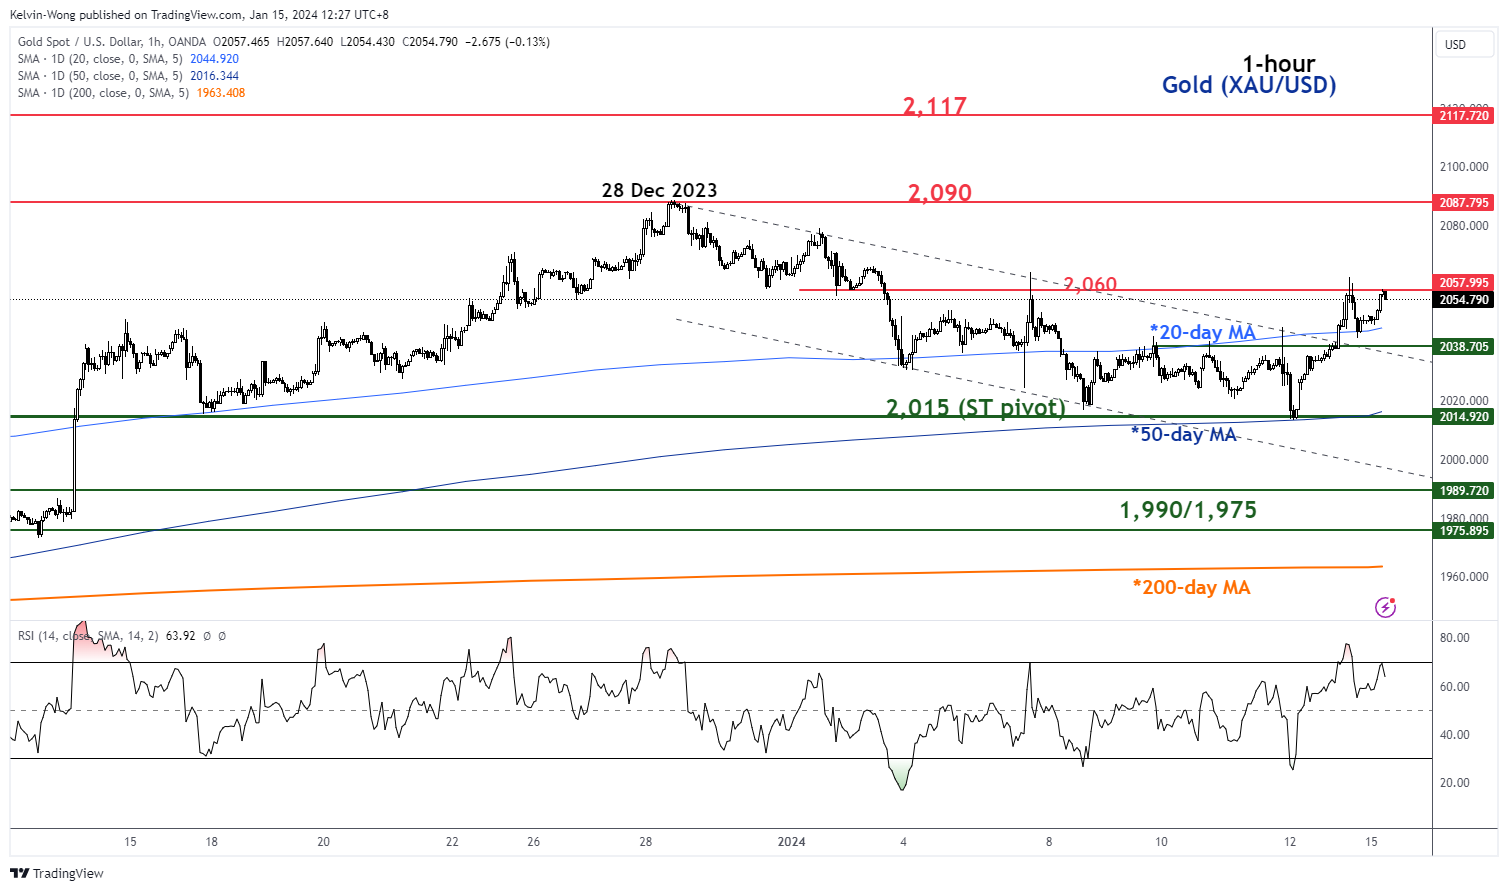
Fig 4: Gold (XAU/USD) minor short-term trend as of 15 Jan 2024 (Source: TradingView, click to enlarge chart)
The price actions of Gold (XAU/USD) have staged a “V-shaped” bullish reversal in the latter half of last week right at the lower boundary of the medium-term ascending channel in place since the 6 October 2023 swing low that is acting as a support at US$2,015 coupled with a bullish momentum condition flashed out by the daily RSI momentum indicator at around the 50 level.
In the shorter term as seen on the 1-hour chart, it has staged a clearance above the upper boundary of a former minor descending channel in place since 28 December 2023, and the 20-day moving average.
The next intermediate resistance to watch will be at US$2,090; a 6-week range resistance since 4 December 2023. A clearance above it sees the next intermediate resistance coming in at US$2,117.
On the flip side, failure to hold at the US$2,015 short-term pivotal support negates the bullish tone to expose the medium-term support zone of US$1,990/1,975 (also close to the 200-day moving average).
Content is for general information purposes only. It is not investment advice or a solution to buy or sell securities. Opinions are the authors; not necessarily that of OANDA Business Information & Services, Inc. or any of its affiliates, subsidiaries, officers or directors. If you would like to reproduce or redistribute any of the content found on MarketPulse, an award winning forex, commodities and global indices analysis and news site service produced by OANDA Business Information & Services, Inc., please access the RSS feed or contact us at [email protected]. Visit https://www.marketpulse.com/ to find out more about the beat of the global markets. © 2023 OANDA Business Information & Services Inc.
Latest posts by Kelvin Wong (see all)
- SEO Powered Content & PR Distribution. Get Amplified Today.
- PlatoData.Network Vertical Generative Ai. Empower Yourself. Access Here.
- PlatoAiStream. Web3 Intelligence. Knowledge Amplified. Access Here.
- PlatoESG. Carbon, CleanTech, Energy, Environment, Solar, Waste Management. Access Here.
- PlatoHealth. Biotech and Clinical Trials Intelligence. Access Here.
- Source: https://www.marketpulse.com/commodities/gold-potential-bullish-breakout-from-6-week-range/kwong

