The Grayscale Bitcoin Trust (GBTC) share price has again made headlines. Its premium or discount to Bitcoin’s net asset value (NAV), often viewed as an indicator of institutional sentiment towards the cryptocurrency, has displayed a notable trend recently, even amid the prevailing bearish atmosphere.
GBTC’s Evolving Price Dynamics
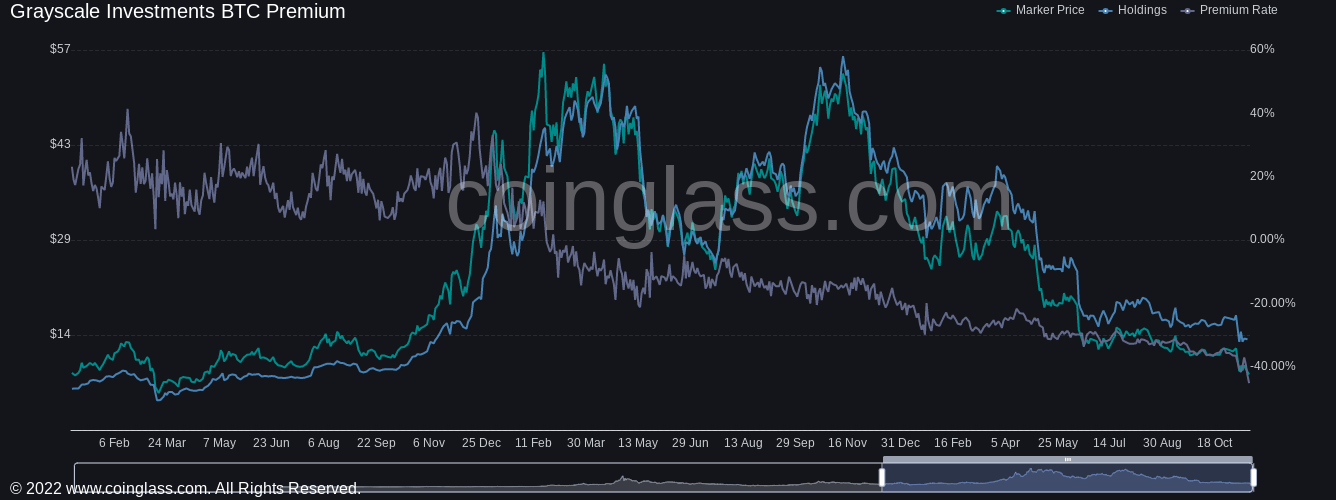
The phenomenon of GBTC’s share price inching closer to Bitcoin’s market price is worth noting. The correlation between the two has been historically significant, with price differences often shedding light on broader market sentiments.
According to data from CoinGlass, a renowned crypto monitoring platform, the GBTC shares were recorded trading at a 17.17% discount to the BTC/USD rate as of September 9th, the last update.
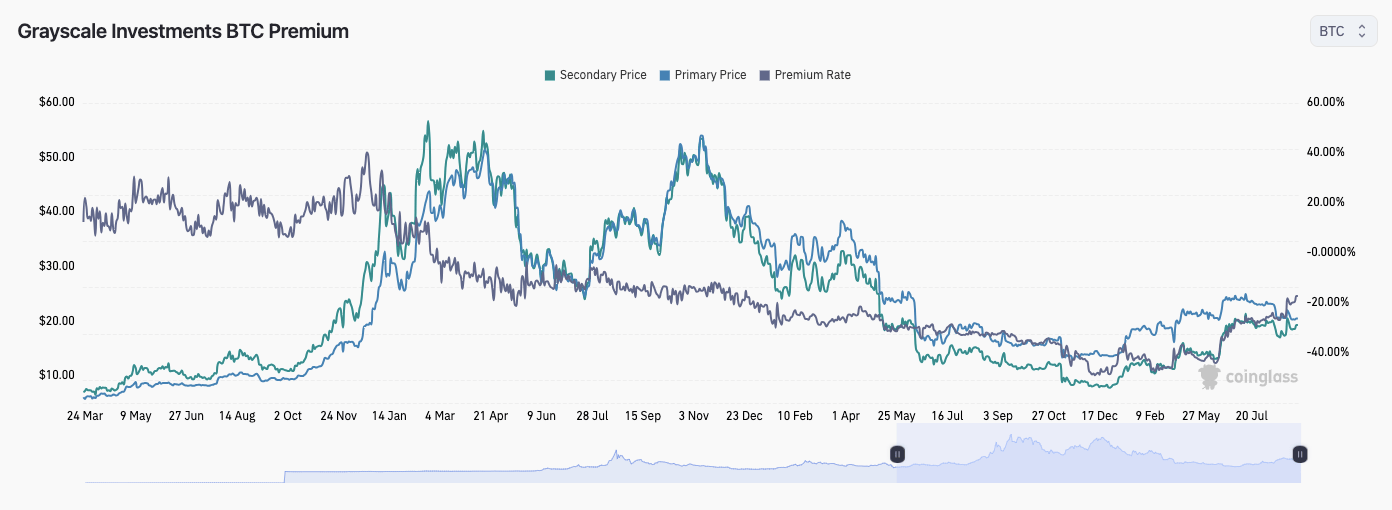
Such levels haven’t been witnessed since December 2021, highlighting a potentially shifting sentiment in the market. The so-called “GBTC Premium,” previously a surplus, has been a discount to the net asset value for a while now.
The shift was drastic at one juncture that the differences neared roughly 50% last November. Such variance has led to a divergence between GBTC’s performance and Bitcoin’s price strength, especially as Bitcoin revisits price zones it hasn’t seen in the past six months.
What This Could Mean For Bitcoin
The narrowing of GBTC’s discount isn’t just an isolated event. It paints a broader picture of potential market sentiment shifts and future movements.
Notably, a shrinking discount can be interpreted as a sign of growing institutional interest, as the GBTC serves as a prominent avenue for institutions to gain exposure to Bitcoin without directly holding the asset. If institutional interest is indeed on the rise, this could bode well for Bitcoin’s mid to long-term price outlook.
Nevertheless, Bitcoin is currently seeing a downtrend. The asset has plunged nearly 15% in the past month and 2% in the last 24 hours. As a result, its price has fallen below the recently established $26,000 mark, trading at $25,175 at the time of writing.
According to Cryptocon, a trader and analyst, Bitcoin might see a weaker performance this month as October often brings a turnaround and more decisive price action.
September is historically a pretty bad month for #Bitcoin, that’s just the facts.
October is historically very bullish.
But maybe, it’s November that will bring the turn around we need according to our performance since the halving dates.
To be… pic.twitter.com/Olg0XHVxKG
— CryptoCon (@CryptoCon_) September 11, 2023
This perspective aligns with a prevalent crypto community theory that marks November 28th as a quadrennial “bull run launch” for Bitcoin.
Featured image from iStock, Chart from TradingView
- SEO Powered Content & PR Distribution. Get Amplified Today.
- PlatoData.Network Vertical Generative Ai. Empower Yourself. Access Here.
- PlatoAiStream. Web3 Intelligence. Knowledge Amplified. Access Here.
- PlatoESG. Automotive / EVs, Carbon, CleanTech, Energy, Environment, Solar, Waste Management. Access Here.
- PlatoHealth. Biotech and Clinical Trials Intelligence. Access Here.
- ChartPrime. Elevate your Trading Game with ChartPrime. Access Here.
- BlockOffsets. Modernizing Environmental Offset Ownership. Access Here.
- Source: https://www.bitcoinnewsminer.com/gbtcs-discount-narrows-amid-bitcoins-downturn-but-a-bullish-trend-is-coming/

