Ethereum price is correcting gains below the $2,350 zone. ETH could attempt a fresh increase unless there is a close below the $2,200 support.
- Ethereum is correcting gains and trading below the $2,350 level.
- The price is trading below $2,320 and the 100-hourly Simple Moving Average.
- There is a key bearish trend line forming with resistance near $2,300 on the hourly chart of ETH/USD (data feed via Kraken).
- The pair could start a fresh increase if there is a close above the $2,350 level.
Ethereum Price Eyes Fresh Increase
Ethereum price struggled to clear the $2,440 resistance zone and started a fresh decline. ETH declined below the $2,350 support zone to move into a short-term bearish zone, like Bitcoin.
There was a close below the $2,320 level. A low was formed near $2,258 and the price is now consolidating losses. Ethereum is now trading below $2,320 and the 100-hourly Simple Moving Average. There is also a key bearish trend line forming with resistance near $2,300 on the hourly chart of ETH/USD.
On the upside, the price is facing resistance near the $2,300 level and the trend line. It is close to the 23.6% Fib retracement level of the downward move from the $2,445 swing high to the $2,258 low.
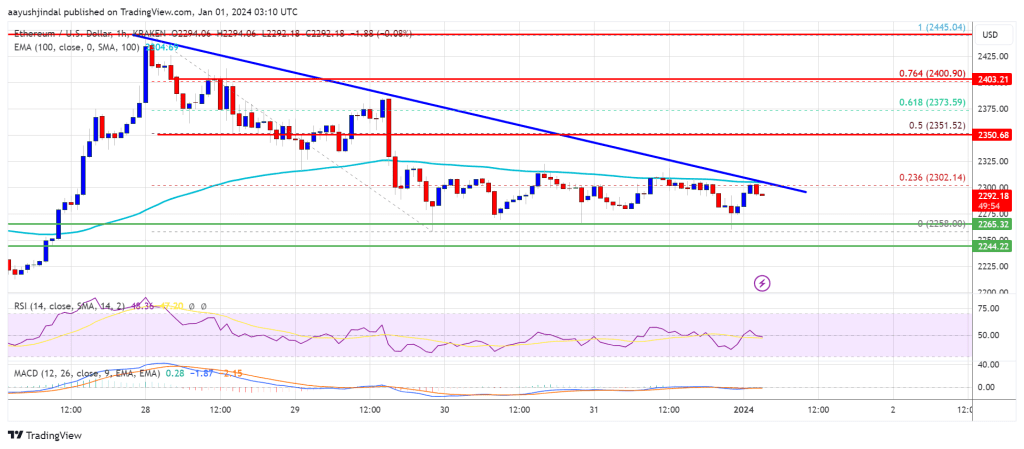
Source: ETHUSD on TradingView.com
The first major resistance is now near $2,350 or the 50% Fib retracement level of the downward move from the $2,445 swing high to the $2,258 low. A close above the $2,350 resistance could send the price toward $2,400. The next key resistance is near $2,440. A clear move above the $2,440 zone could start another increase. The next resistance sits at $2,500, above which Ethereum might rally and test the $2,550 zone.
More Losses in ETH?
If Ethereum fails to clear the $2,300 resistance, it could continue to move down. Initial support on the downside is near the $2,250 level.
The first key support could be the $2,240 zone. A downside break and a close below $2,240 might start another major decline. In the stated case, Ether could test the $2,200 support. Any more losses might send the price toward the $2,120 level.
Technical Indicators
Hourly MACD – The MACD for ETH/USD is losing momentum in the bearish zone.
Hourly RSI – The RSI for ETH/USD is now below the 50 level.
Major Support Level – $2,240
Major Resistance Level – $2,350
Disclaimer: The article is provided for educational purposes only. It does not represent the opinions of NewsBTC on whether to buy, sell or hold any investments and naturally investing carries risks. You are advised to conduct your own research before making any investment decisions. Use information provided on this website entirely at your own risk.
- SEO Powered Content & PR Distribution. Get Amplified Today.
- PlatoData.Network Vertical Generative Ai. Empower Yourself. Access Here.
- PlatoAiStream. Web3 Intelligence. Knowledge Amplified. Access Here.
- PlatoESG. Carbon, CleanTech, Energy, Environment, Solar, Waste Management. Access Here.
- PlatoHealth. Biotech and Clinical Trials Intelligence. Access Here.
- Source: https://www.newsbtc.com/analysis/eth/ethereum-price-could-start-2024-bang/

