
Published 17 hours ago
Ethereum Price Analysis: The ongoing correction in Ethereum price took a slight sideways detour in response to the flattish behavior of the world’s largest cryptocurrency Bitcoin. The consolidation is confined between $1830-$1770, creating a narrow range. Thus, a breakout beyond the aforementioned range with daily candle closing is needed to free the ETH price from current uncertainty.
advertisement
Key Points:
- The Ethereum price resonates within a narrow range of $1830-$1770 can be considered a no-trading zone
- The 100-day EMA at $1770 gives additional support to buyers to sustain higher chart levels
- The intraday trading volume in Ether is $5.59 Billion, indicating a 3.48% gain.
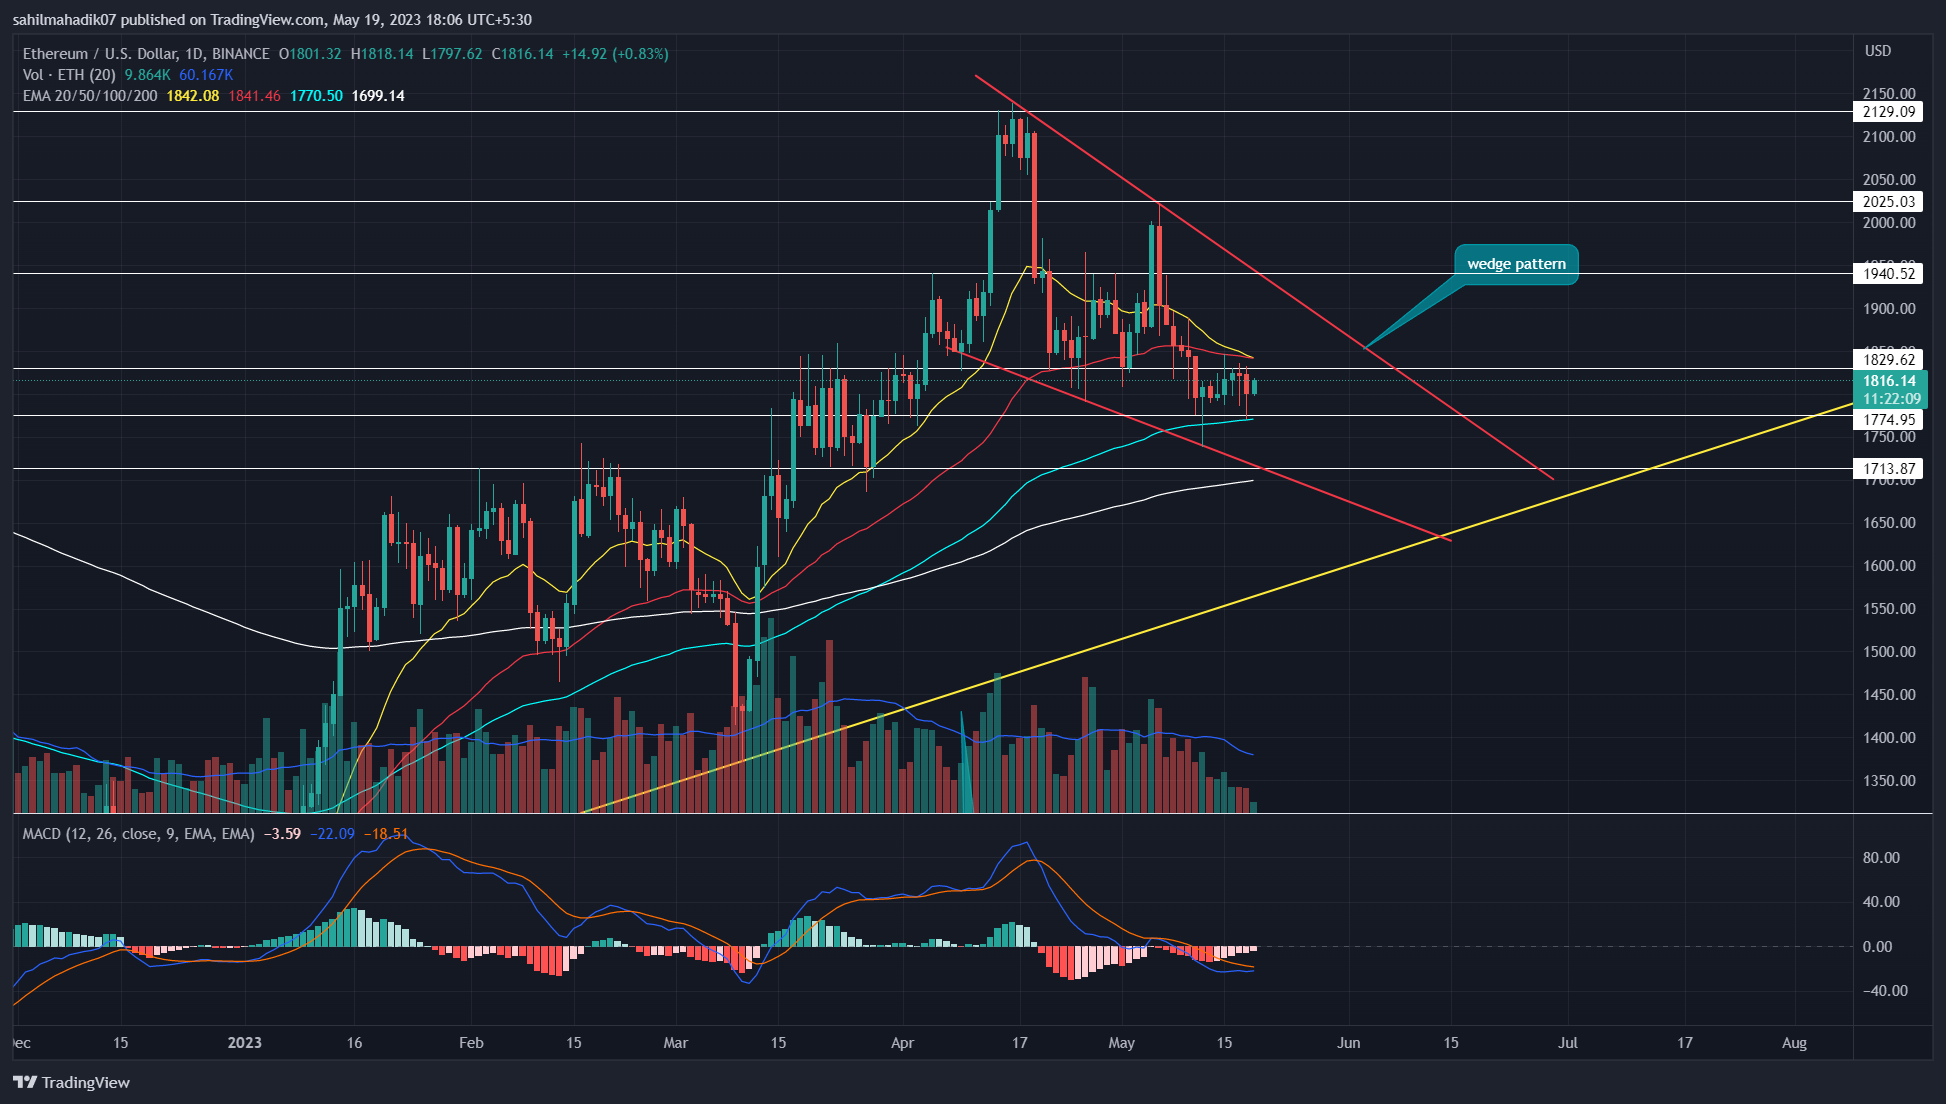
Source- Tradingview
Today, the Ethereum price trades at $1800, and continues its sideways trend within the fixed range of $1830-$1770. The formation of green and red candles on an alternative basis shows no clear sign of dormant force in the market.
Thus, the new trades must wait for a decisive breakout with the daily candle closing beyond the range levels to confirm the potential market trend.
Also Read: Top BRC – 20 Tokens Set To Take The Next Big Leap
A breakout of $1830 will increase buying momentum in the market, and more likely raise the ETH price by 3.5% to hit the overhead trendline of the wedge pattern. However, the aforementioned pattern is carrying current correction in ETH.
Therefore, a bullish breakout from the wedge pattern will be the key signal to the resumption of a bullish trend.
However, the current correction has not yet breached the 505 Fibonacci retracement level and reflects the overall market trend bullish.
Technical Indicator
Moving Average Convergence Divergence: The flattish MACD(blue) and signal(orange) line project the market trend is currently uncertain.
Bollinger Band: The down-sloping lower band on the BB indicator reflects the selling momentum in the market is still aggressive.
Ethereum Coin Price Intraday Levels-
- Spot rate: $1814
- Trend: Bullish
- Volatility: High
- Resistance level- $1830 and $1940
- Support level- $1790 and $1700
Share this article on:
advertisement
The presented content may include the personal opinion of the author and is subject to market condition. Do your market research before investing in cryptocurrencies. The author or the publication does not hold any responsibility for your personal financial loss.
<!– Close Story–>
- SEO Powered Content & PR Distribution. Get Amplified Today.
- PlatoAiStream. Web3 Data Intelligence. Knowledge Amplified. Access Here.
- Minting the Future w Adryenn Ashley. Access Here.
- Buy and Sell Shares in PRE-IPO Companies with PREIPO®. Access Here.
- Source: https://coingape.com/markets/ethereum-price-analysis-eth-price-to-reclaim-2000-mark-is-dependant-on-these-factors/

