
Published 3 hours ago
Crypto price today Feb 27th: the crypto market started the new week with a green flag showcasing its sustainability at higher levels. The Bitcoin price jumped 0.8% today trying to undermine last week’s correction. Thus, the market sentiment turns on relief rally sentiment pushing several crypto coins to higher levels.
advertisement
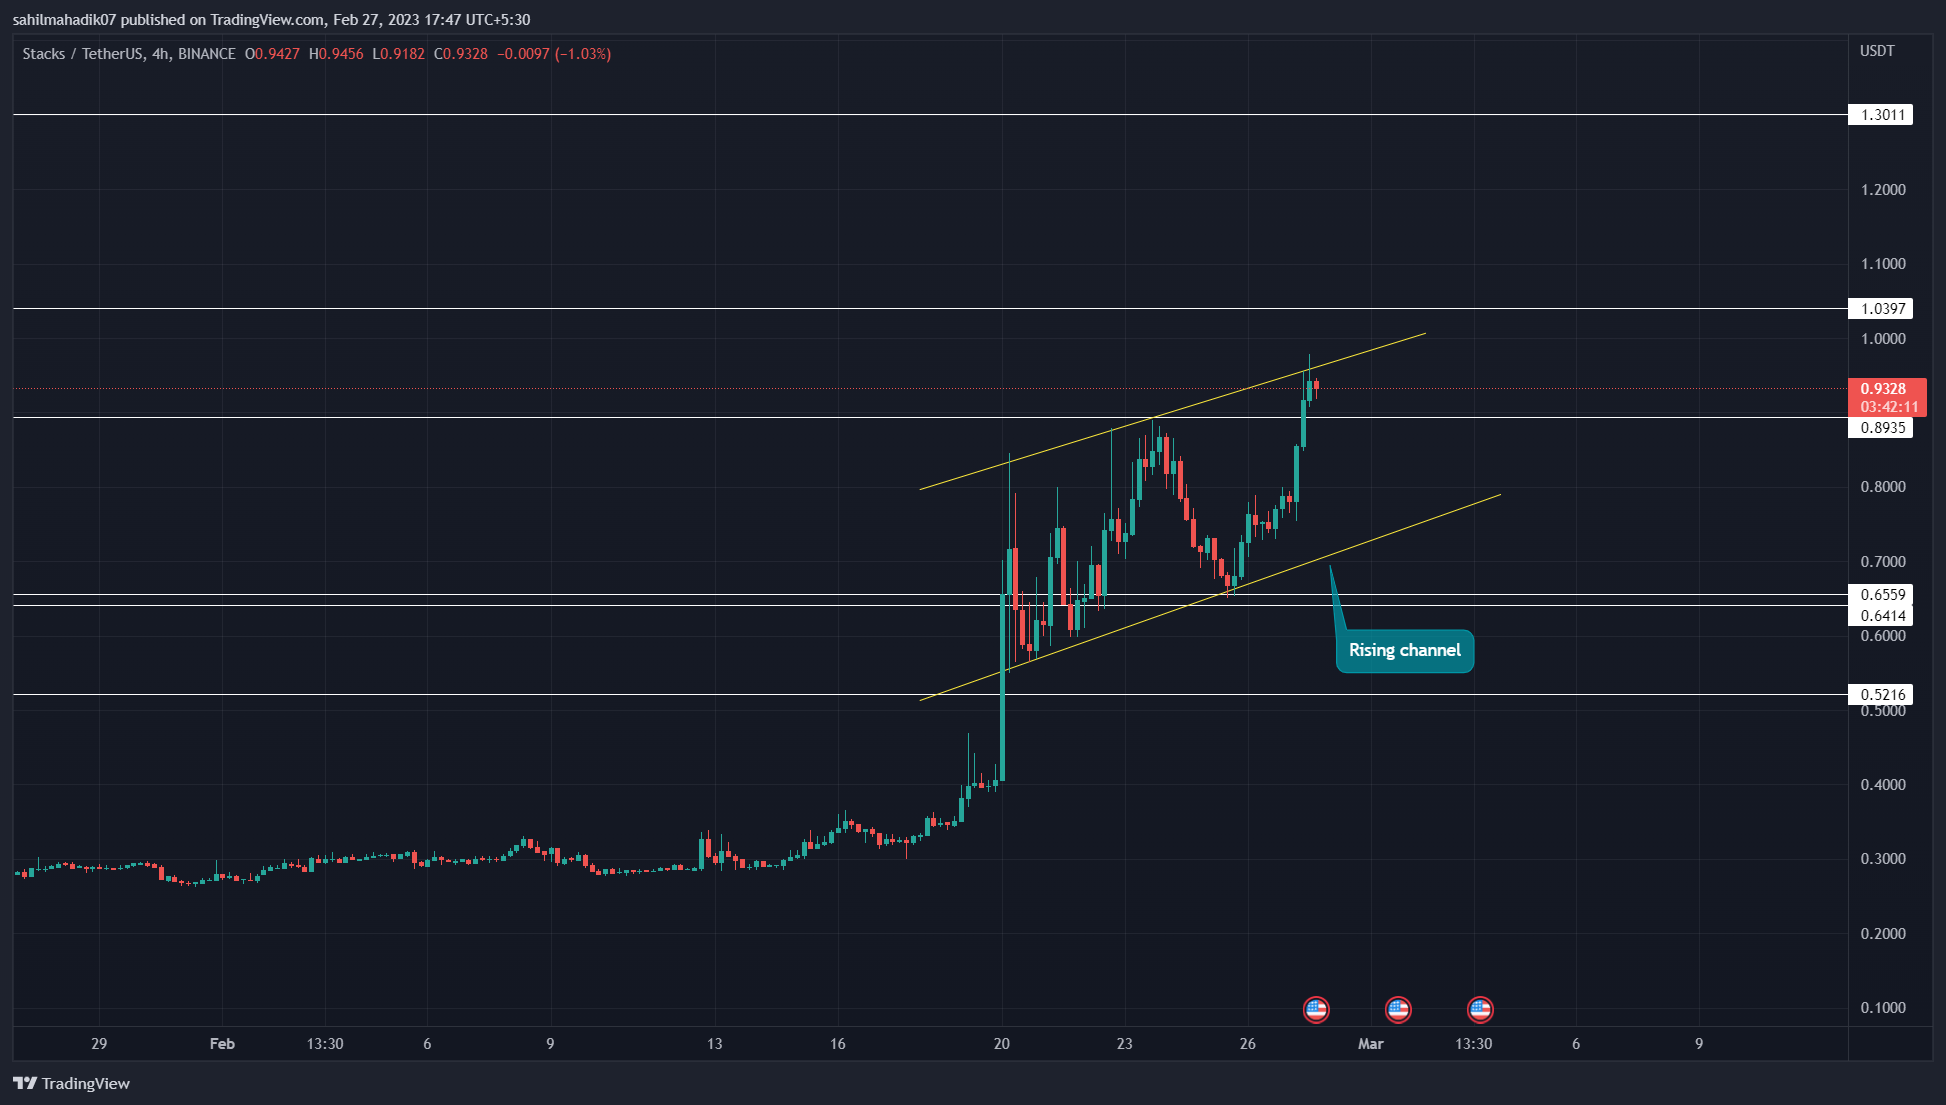
Stack(STX)
Source- Tradingview
Last week while the crypto market witnessed a significant downfall, the Stacks coin price carried a slow yet sustained recovery within the rising channel pattern. The coin price resonating between the two trendlines has reached a ten-month high where it currently trades at $0.95.
Today, the STX price witnessed a 22% intraday jump and breached the last swing high resistance of $0.39. Thus, until this pattern is intact, the Stacks coin holders could witness a prolonged recovery.
Trending Stories
On a contrary note, the coin currently wobbling below the overhead trendline could experience the temporary correction
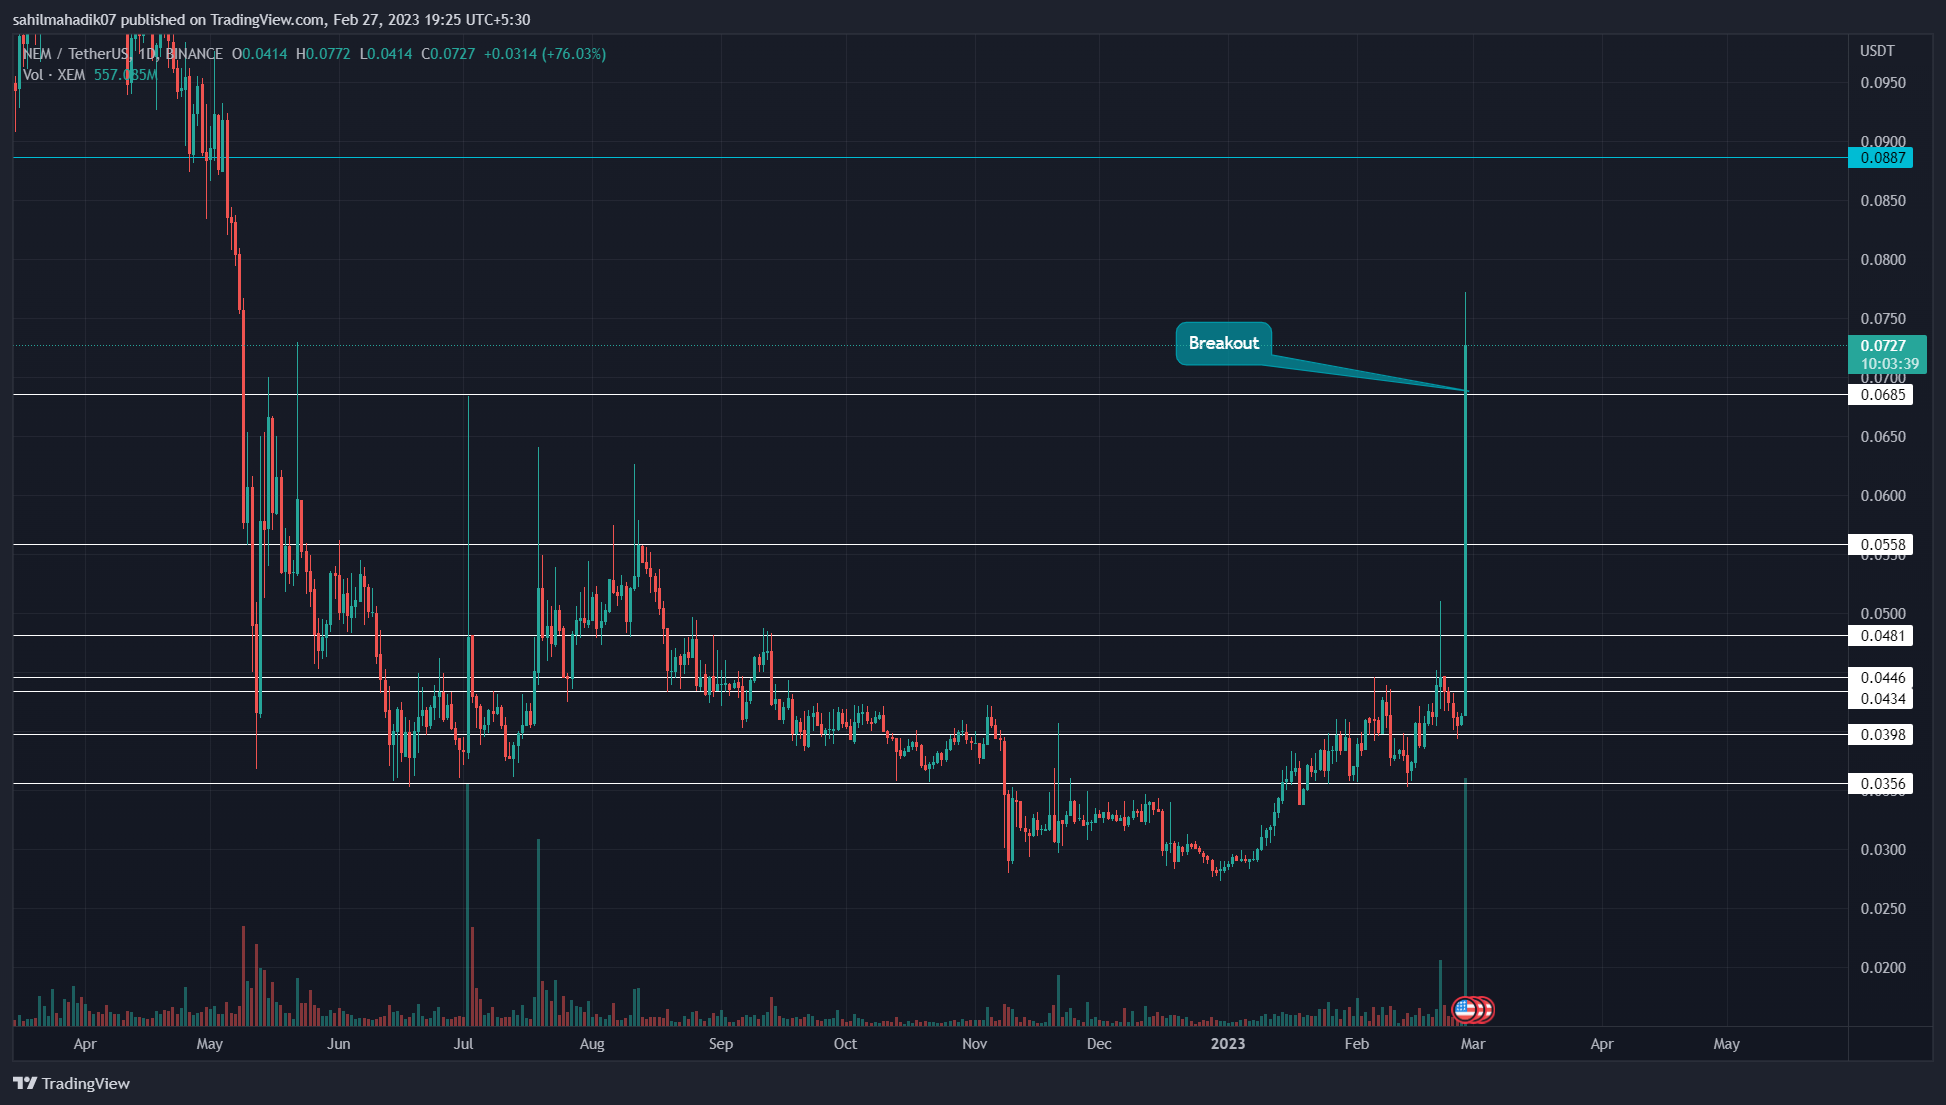
NEM(XEM)
Source- Tradingview
While the crypto market eased on its sell-off last week, the XEM price resumed its bullish recovery with a big band. Today, the coin price witnessed a significant inflow and recorded a 74% price jump to its $0.073 mark.
This long bullish candle gave a massive breakout from the monthly resistance of $0.0685. This breakout should offer buyers a significant footing to extend the current bullish trend.
Thus, if the daily candle closes above $0.0685, the buyers could drive the altcoin rise 23% higher to hit the 0.088 mark.
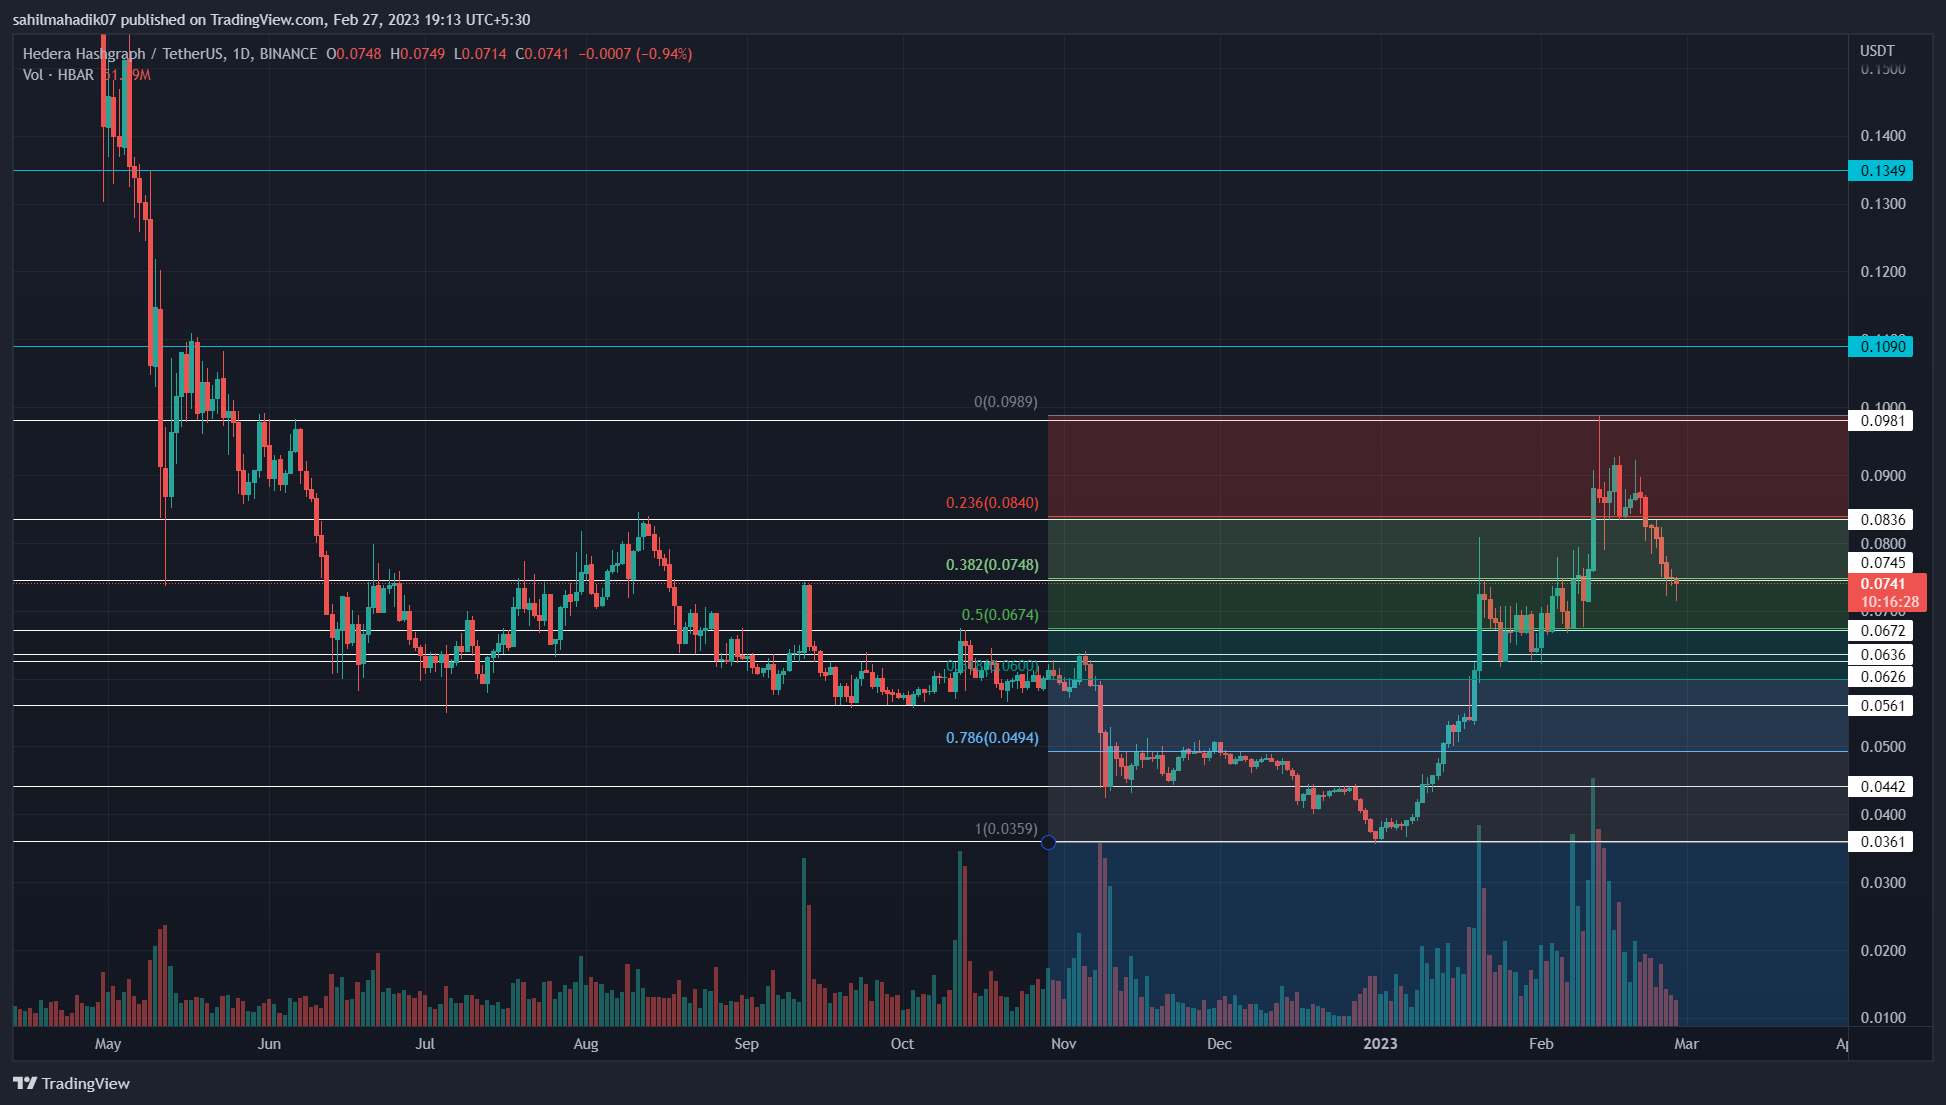
Hedera(HBAR)
Source- Tradingview
Amid the recent downfall in the crypto market, the Hedera coin price has tumbled 27% from the $0.098 peak. With sustained selling, the HBAR price is down 3.07% today and breached the combined support of $0.0745 and 0.382 Fibonacci retracement levels.
This bearish breakdown may intensify the ongoing selling pressure and drive the price to lower levels. If the daily candle closes below the $0.0745 mark, the sellers may plunge the altcoin to $0.067(0.5FIB) or $0.06.
These aforementioned supports are strong enough to replenish the bullish momentum and encourage buyers to resume prior recovery.
Quant(QNT)

Source- Tradingview
Over the last five weeks, the Quant price has been falling under the influence of a resistance trendline. The altcoin is facing constant resistance from this falling trendline and witnessed a 21.6% loss from the last six-month high of $165.
By the press, the coin price shows a 2.5% intraday drop which plunged the coin below the $130-129.5 support zone. If the daily candle closes below the $129.5 mark, the QNT holders could witness further correction.
advertisement
The potential downfall could tumble the prices 10% down to hit $116 support.
Share this article on:
advertisement
The presented content may include the personal opinion of the author and is subject to market condition. Do your market research before investing in cryptocurrencies. The author or the publication does not hold any responsibility for your personal financial loss.
<!– Close Story–>
- SEO Powered Content & PR Distribution. Get Amplified Today.
- Platoblockchain. Web3 Metaverse Intelligence. Knowledge Amplified. Access Here.
- Source: https://coingape.com/markets/crypto-price-today-feb-relief-rally-in-crypto-market-soars-altcoins-higher/

