- ADA price is gaining bearish momentum below the $0.325 support zone against the US Dollar.
- The price is now trading below $0.320 and the 55 simple moving average (4 hours).
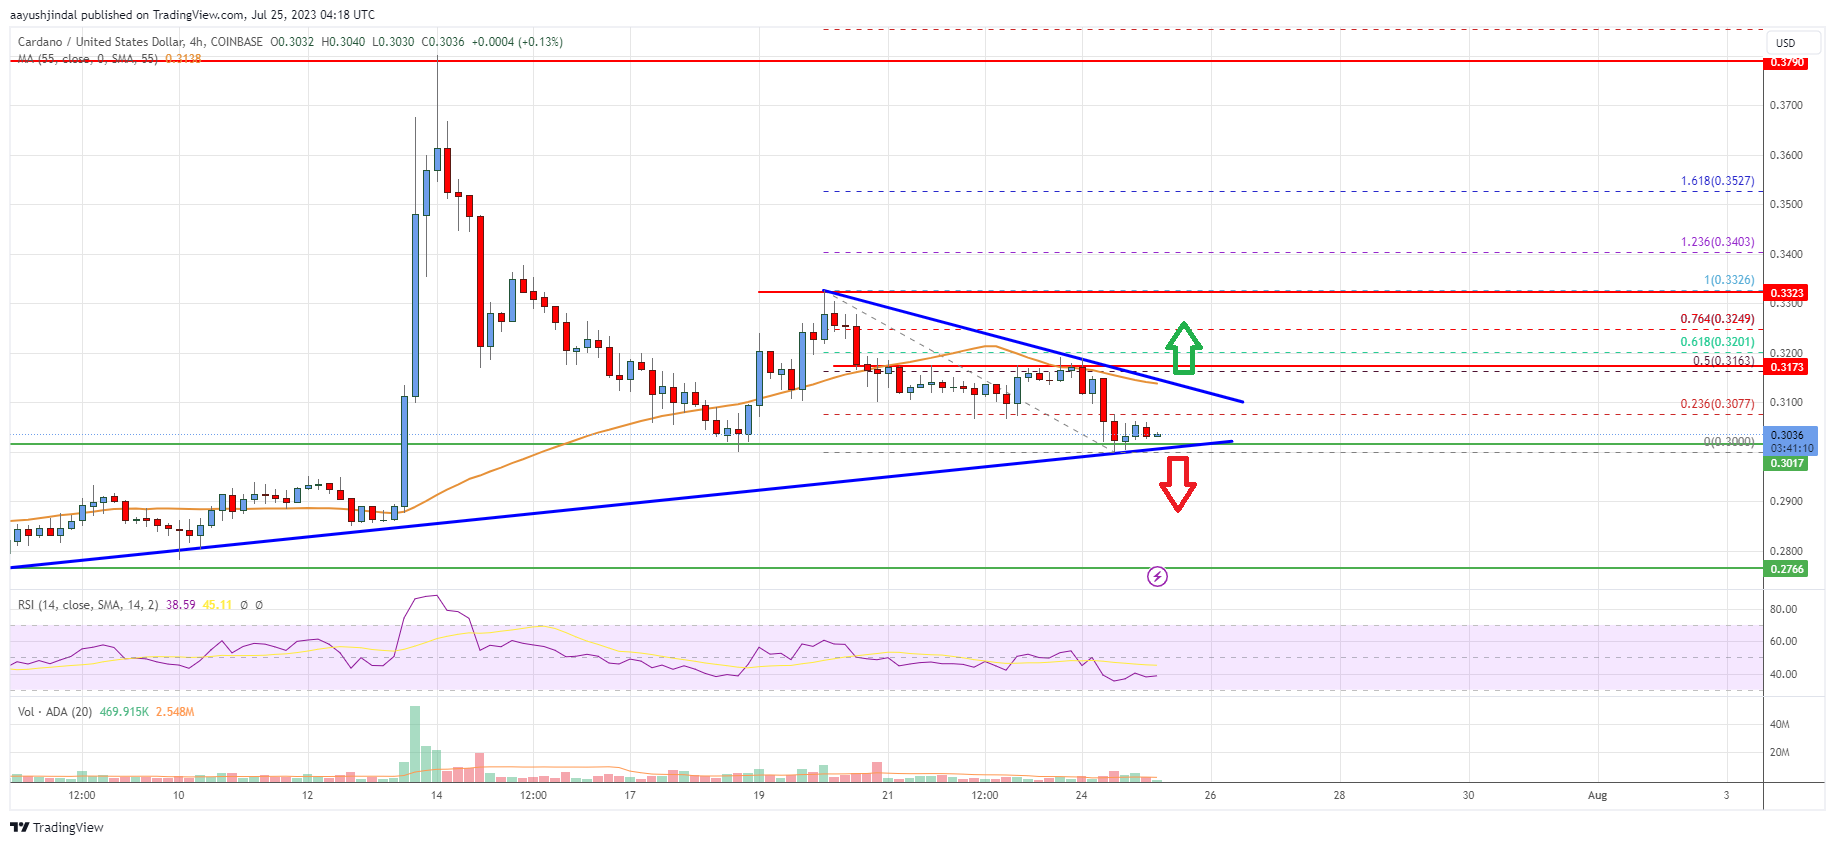
- There is a key contracting triangle forming with resistance near $0.3110 on the 4-hour chart (data feed via Coinbase).
- The price could continue to move down if it stays below the $0.325 resistance zone.
Cardano price is struggling below $0.320 against the US Dollar, similar to Bitcoin. ADA price could start a fresh increase if it clears the $0.320 and $0.325 resistance levels.
Cardano Price Analysis
This past week, Cardano price saw a rejection pattern near the $0.332 zone against the US Dollar. The ADA/USD pair declined below the $0.325 and $0.320 support levels.
The price even declined below the $0.305 support and the 55 simple moving average (4 hours). It revisited the $0.300 support zone. A low is formed near $0.300 and the price is consolidating losses. It is now trading below $0.320 and the 55 simple moving average (4 hours).
On the upside, immediate resistance is near the $0.308 zone or the 23.6% Fib retracement level of the downward move from the $0.3326 swing high to the $0.300 low.
The first major resistance is near the $0.315 level. It is close to the 50% Fib retracement level of the downward move from the $0.3326 swing high to the $0.300 low. There is also a key contracting triangle forming with resistance near $0.3110 on the 4-hour chart.
A clear upside break above the $0.315 level might send Cardano price toward the $0.332 resistance. Any more gains could start a steady increase toward the $0.350 level or even $0.400.
On the downside, immediate support is near the $0.300 level. The next major support is near the $0.288 level, below which the price may perhaps decline toward the $0.275 support level. Any more losses might call for a test of the $0.250 level.
The chart indicates that ADA price is now trading below $0.315 and the 55 simple moving average (4 hours). Overall, the price could continue to move down if it stays below the $0.320 resistance zone.
Technical Indicators
4 hours MACD – The MACD for ADA/USD is now gaining pace in the bearish zone.
4 hours RSI – The RSI for ADA/USD is now below the 50 level.
Key Support Levels – $0.300 and $0.288.
Key Resistance Levels – $0.315 and $0.325.
- SEO Powered Content & PR Distribution. Get Amplified Today.
- PlatoData.Network Vertical Generative Ai. Empower Yourself. Access Here.
- PlatoAiStream. Web3 Intelligence. Knowledge Amplified. Access Here.
- PlatoESG. Automotive / EVs, Carbon, CleanTech, Energy, Environment, Solar, Waste Management. Access Here.
- BlockOffsets. Modernizing Environmental Offset Ownership. Access Here.
- Source: https://www.livebitcoinnews.com/cardano-ada-price-analysis-risk-of-more-downsides-below-0-30/

