In a recent analysis, crypto analyst Rekt Capital has pinpointed the signs of a potential breakout in the Dogecoin (DOGE) price, which could pave the way for a significant price rally. However, several factors must come together for this scenario to unfold.
Dogecoin Price Ready For A Breakout?
Rekt Capital has shared the following 1-week DOGE/USD chart. According to his analysis, Dogecoin’s price movement has been confined within a descending channel pattern since its peak at the end of last year. This pattern is characterized by two parallel trendlines, representing potential support and resistance levels, with the Dogecoin’s price oscillating between them.
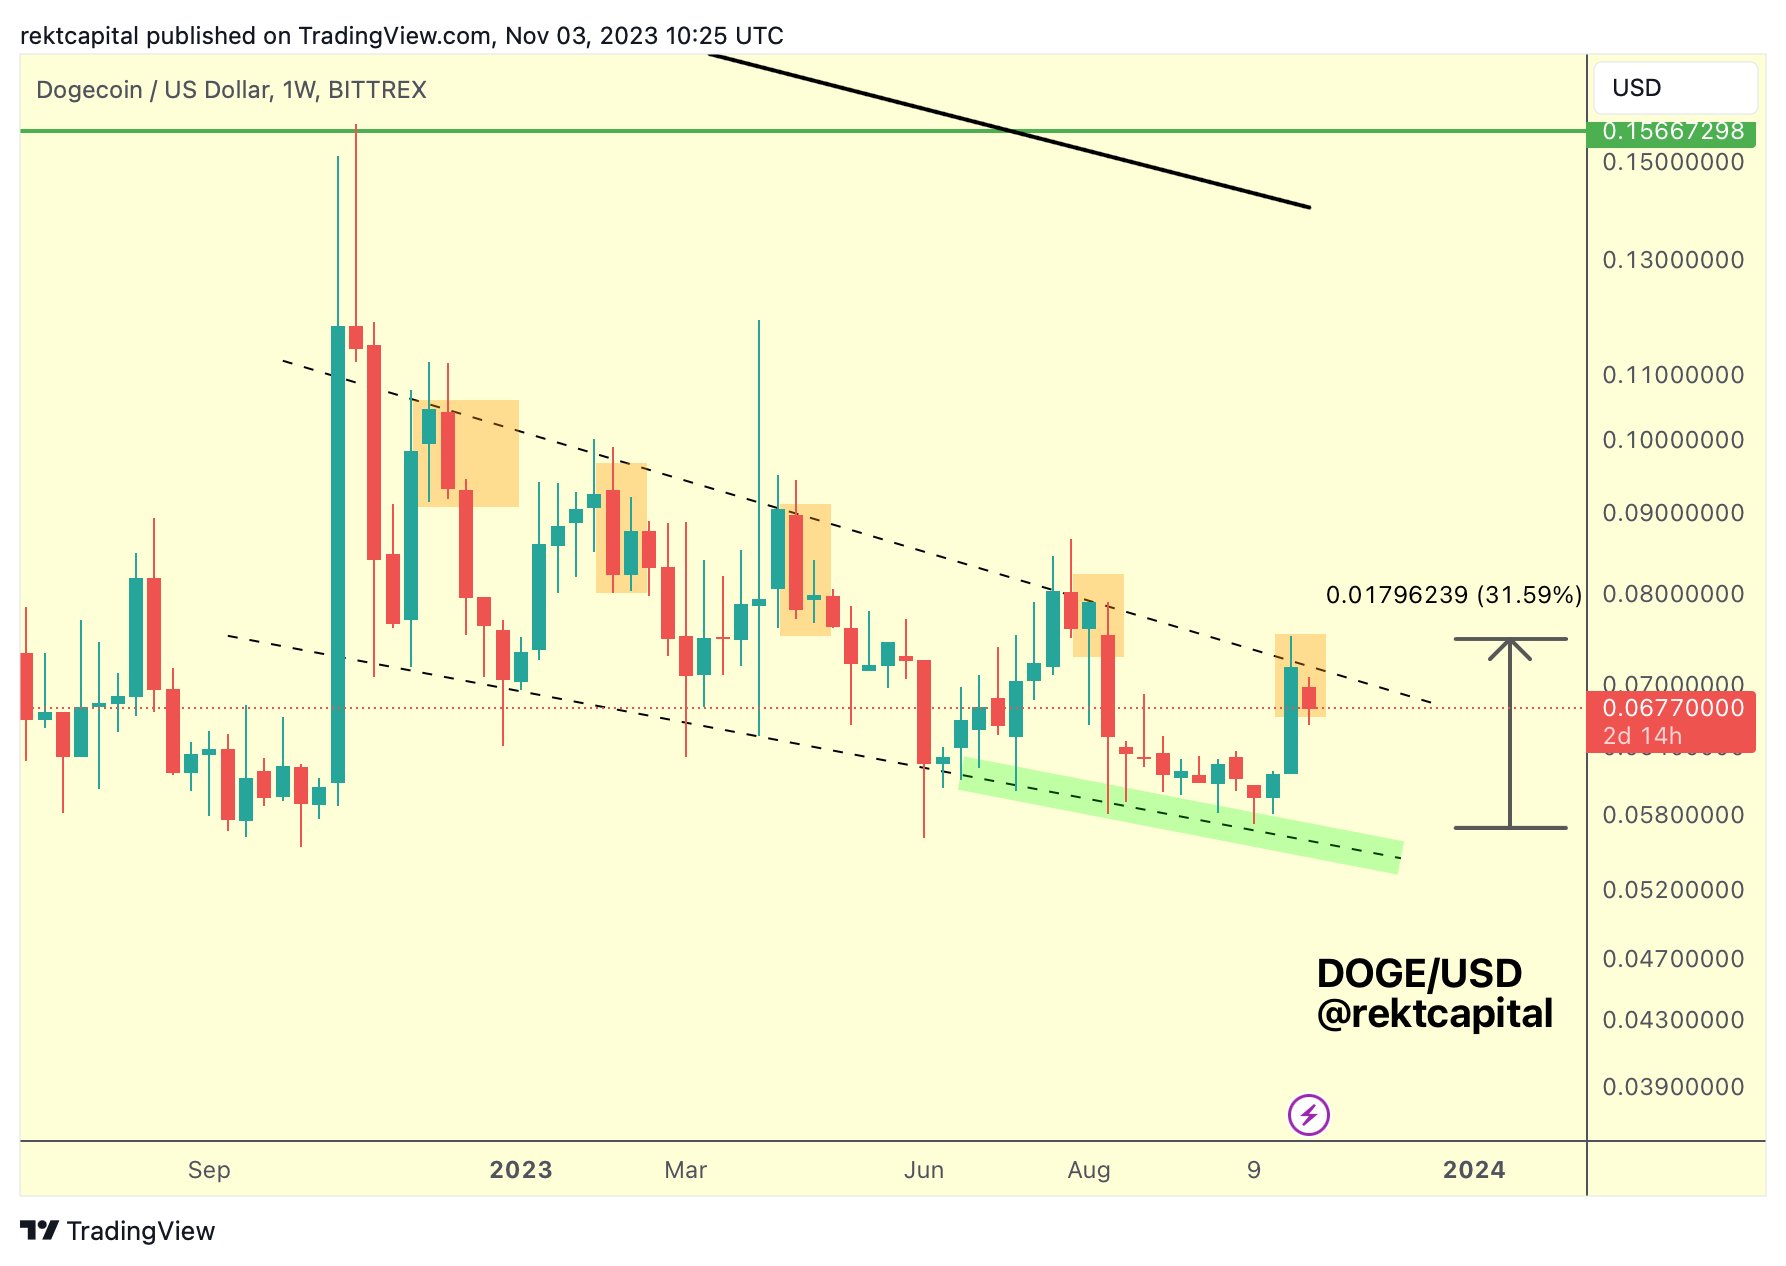
Last Wednesday, DOGE’s price was rejected once again at the upper trendline, making it the fifth rejection within the last year. However, a key observation made by Rekt Capital is the “buy-the-dip” behavior exhibited by traders, which has so far prevented a strong downside continuation. He highlights:
That “buy-the-dip” behavior we saw yesterday is looking like relief under key resistance. However, there has been no strong DOGE rejection & downside continuation. Most important signal is a Weekly Close above Channel Top to confirm a breakout.
As Rekt Capital emphasizes, the most crucial signal for a potential breakout is if Dogecoin can achieve a weekly close above the channel’s top. Therefore, DOGE bulls need to display a strong “buy-the-dip” behavior. Should the price successfully close above the channel top, it could signify a strong bullish trend in the offing.
Potential Price Targets
Turning to the daily chart of DOGE/USD, several key price targets can be deduced based on Fibonacci retracement levels and Exponential Moving Averages (EMAs). The EMAs, which are utilized to pinpoint potential support and resistance levels based on past price data, are showing a cluster around the $0.0660 to $0.0684 range. Currently, DOGE has dropped below the crucial 200-day EMA (blue line) at $0.0684, but found support at 20-day EMA (red line) at $0.0660.
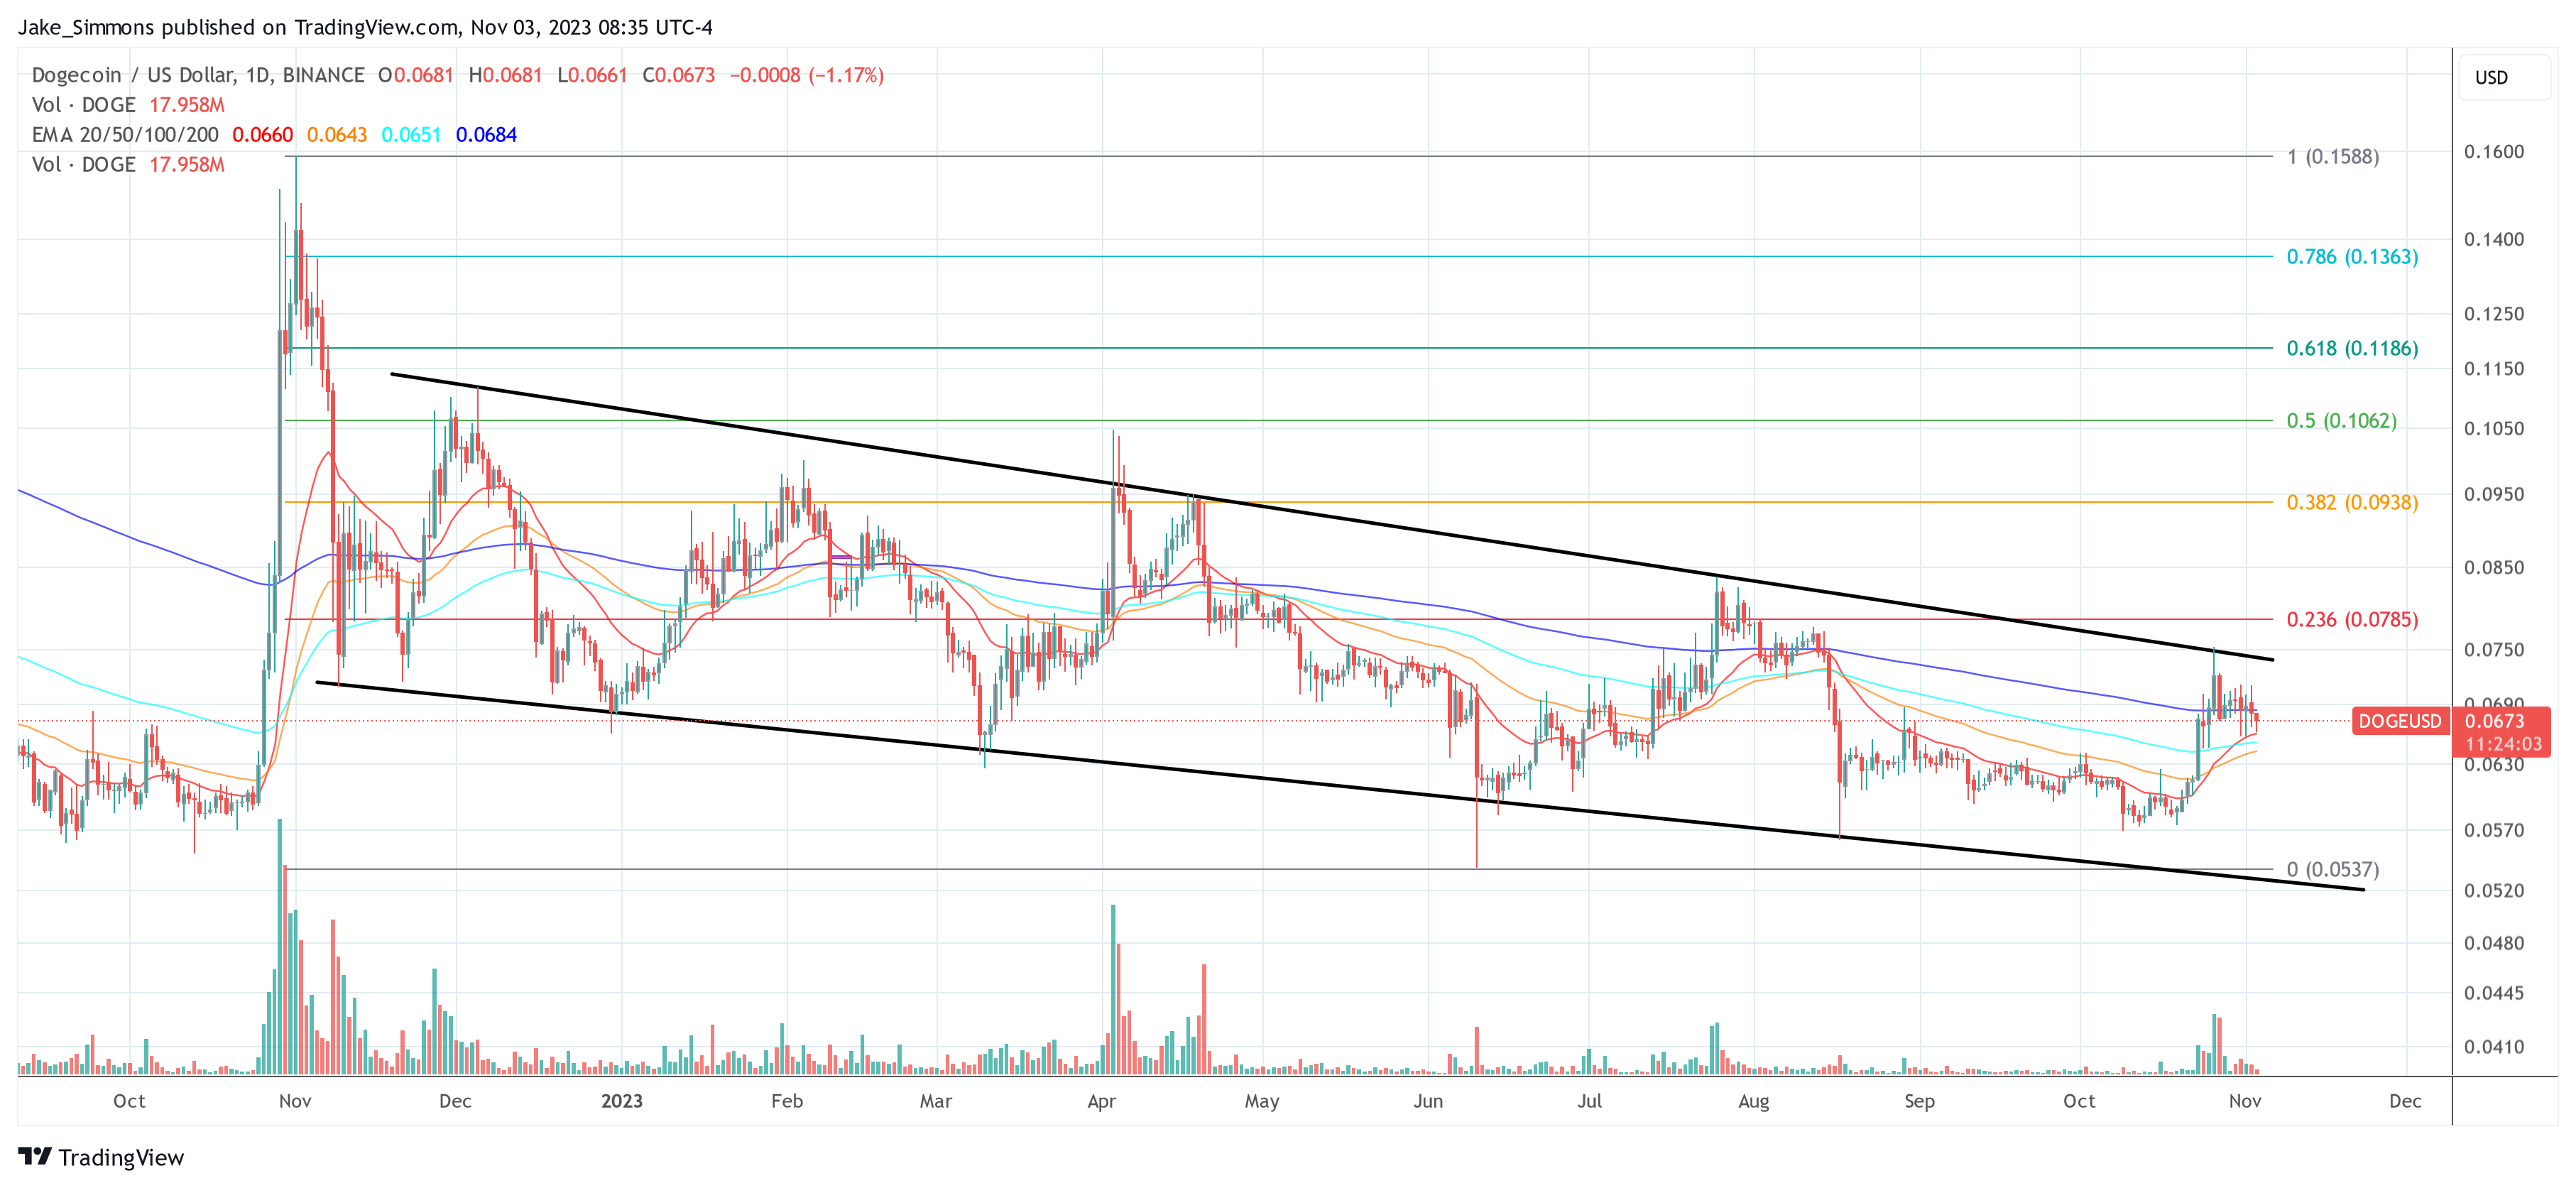
If a breakout from the descending trend channel is successful, the 0.236 Fibonacci level at $0.0785 will probably be the first major price target. If DOGE bounces off this level, a retest of the breakout is very likely – it would be a do-or-die moment for Dogecoin. However, a successful retest could pave the way for DOGE to break above the $0.0785 price level and set the stage for the subsequent price targets.
On the higher side, the Fibonacci retracement levels to watch are 0.382 ($0.0938), 0.5 ($0.1062), 0.618 ($0.1186) and 0.786 ($0.1363), which often act as critical resistance and support zones. The ultimate goal of a potential 135% rally would be the November 1 high at $0.1588.
In conclusion, while the current market sentiments and patterns hint at a potential breakout, it remains imperative for DOGE to secure a weekly close above the channel top. Should this happen, and coupled with supportive market dynamics, Dogecoin could witness a breathtaking rally once again.
Featured image from Kanchanara / Unsplash, chart from TradingView.com
- SEO Powered Content & PR Distribution. Get Amplified Today.
- PlatoData.Network Vertical Generative Ai. Empower Yourself. Access Here.
- PlatoAiStream. Web3 Intelligence. Knowledge Amplified. Access Here.
- PlatoESG. Carbon, CleanTech, Energy, Environment, Solar, Waste Management. Access Here.
- PlatoHealth. Biotech and Clinical Trials Intelligence. Access Here.
- Source: https://www.newsbtc.com/news/dogecoin/can-dogecoin-rally-135-what-needs-to-happen/

